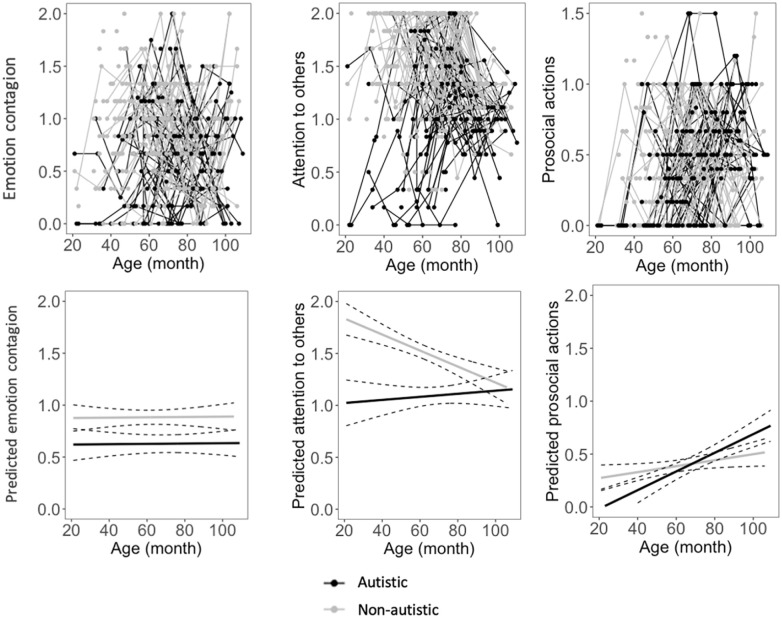
Figure 2.
Developmental trajectories of empathy observed in tasks. Top, from left to right: graphic representations of the levels of observed emotion contagion, attention to others, and prosocial actions at four time points. The points were connected in lines, each line representing one participant. Participants who had data at one time point are presented by points. Bottom, from left to right: regression lines depicting predicted levels of observed emotion contagion, attention to others, and prosocial actions with 95% CIs based on the best age models.

