Figure 1.
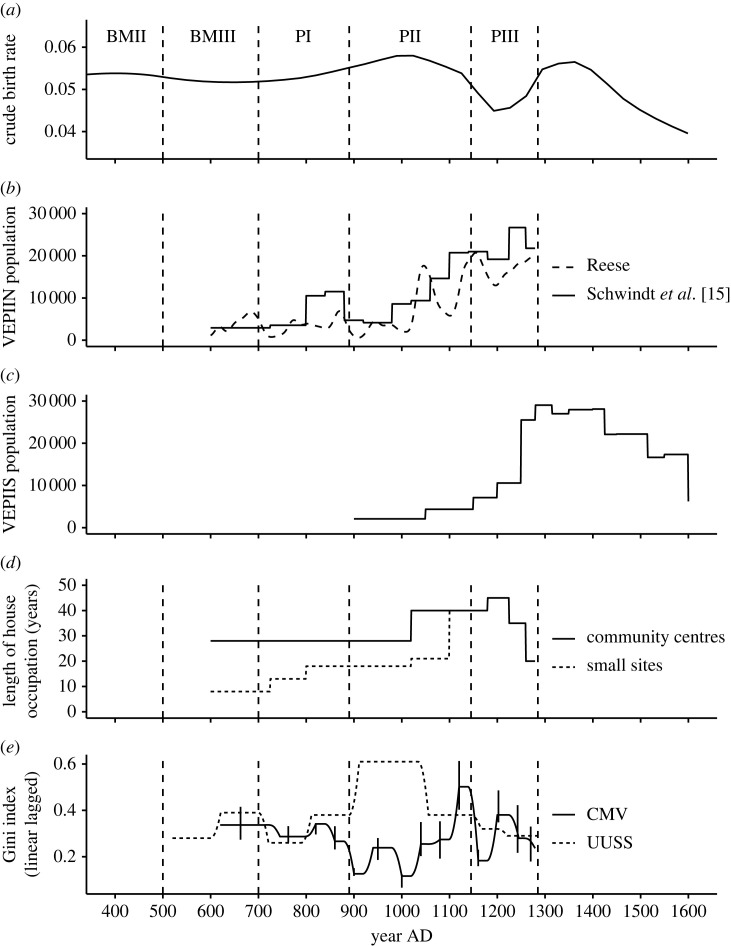
Demographic reconstructions and measures of wealth inequality. (a) Crude birth rates estimated from juvenility index, following [38]. Recomputed for the period shown using data from [33] and a loess smoothing with alpha (span) = 0.5. Spatial scope: US Southwest. (b) Two estimates of population size. Spatial scope: VEPIIN area. Reese [39]. (c) Estimate of population size [16]. Spatial scope: VEPIIS area. (d) Estimates for house longevity in small hamlets and villages [14]. Spatial scope: VEPI area. (e) Estimates of wealth inequality. Spatial scope: the central Mesa Verde (CMV), Chuskas, Chaco and the Middle San Juan regions [27]. BMII, Basketmaker II; PI, Pueblo I (etc.).

