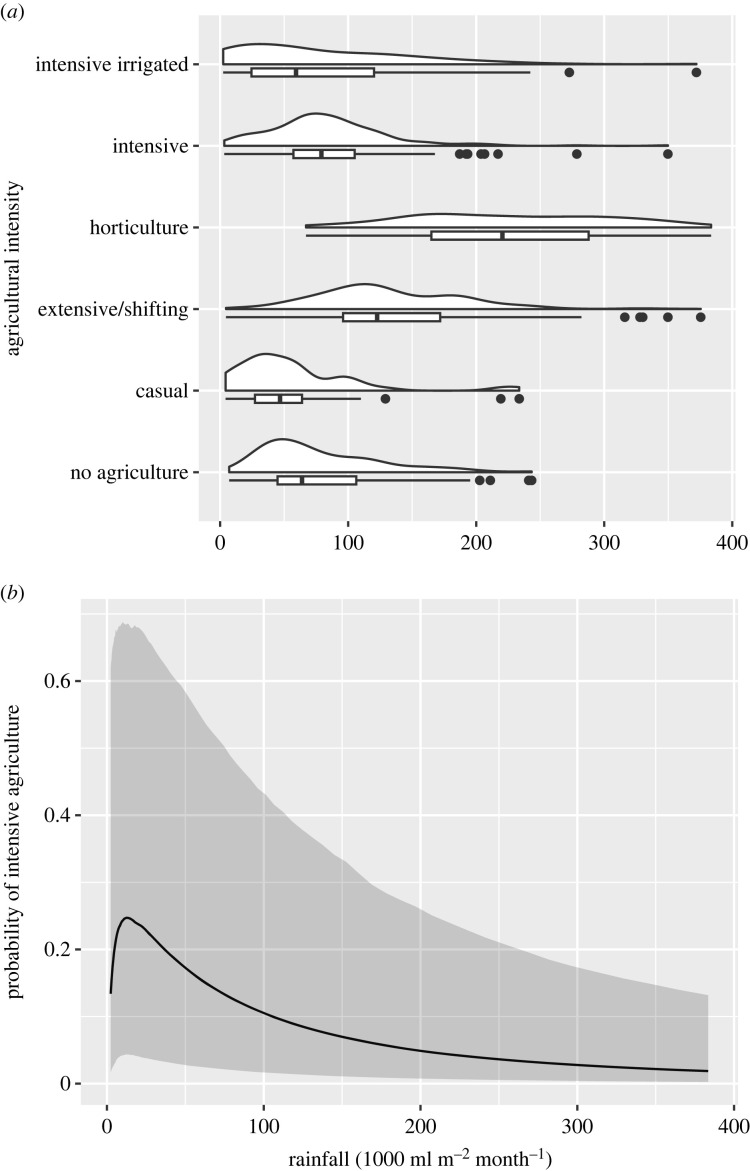
Figure 3.
Rainfall and agriculture intensity. (a) Boxplot and density plots of agricultural intensity and rainfall. The relationship is nonlinear. Intensive and intensive irrigated agriculture occurred at lower rainfall than expected. (b) A Bayesian binomial regression model controlling for phylogeny to predict the probability of intensive agriculture by rainfall for all EA societies (electronic supplementary material, §S3). Intensive agriculture was significantly unlikely at high rainfall compared to other types of agriculture which supports our modified version of the oasis hypothesis.

