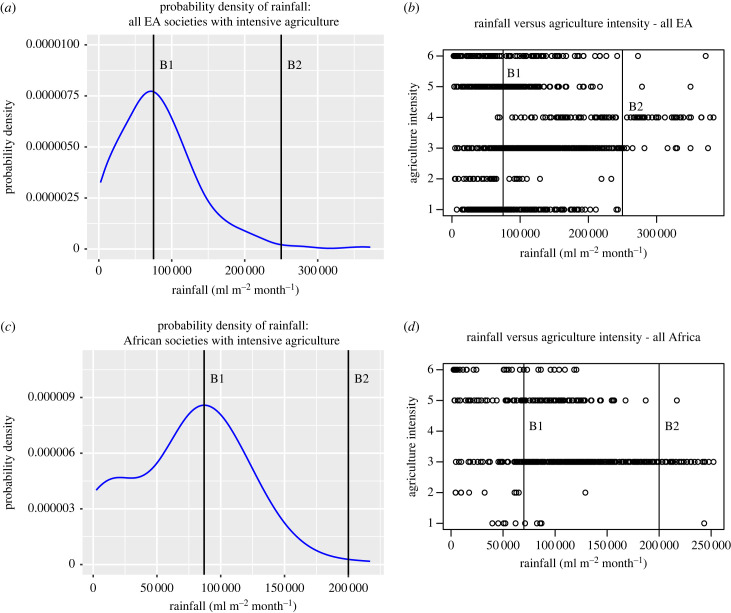
Figure 4.
Probability density plots of intensive agriculture and scatter plots for EA societies (a,b) and African societies (c,d). (a) The probability density for intensive agriculture (AI 5 and 6 combined) for all EA societies. B1 and B2 rainfall values are marked with straight lines. (b) The values of B1 and B2 are marked on a scatterplot of all EA societies with lines. Past B2, agricultural intensity values of 5 and 6 are rare and all intensive agriculture societies were highland farmers.

