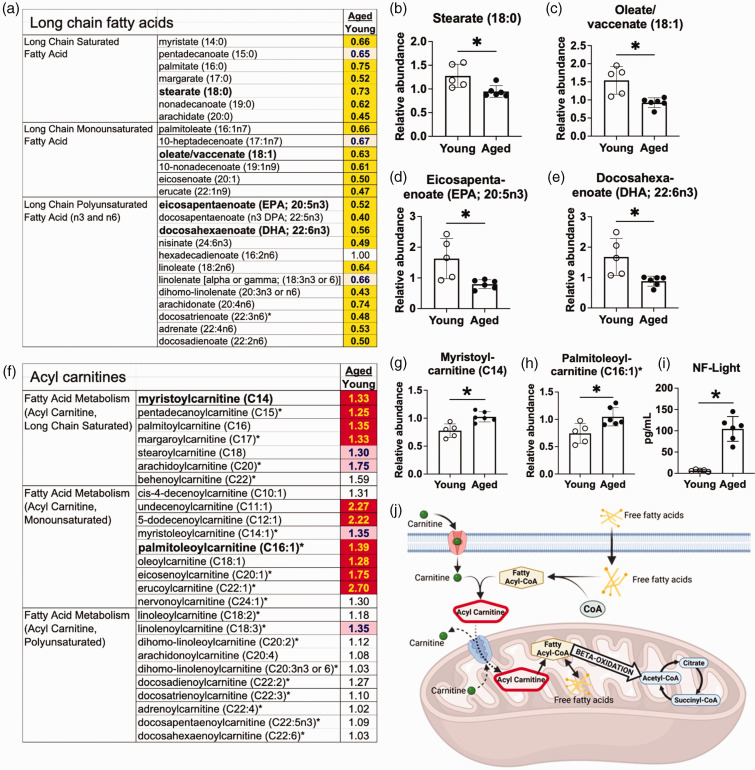
Figure 2.
There is a reduction in long chain fatty acids and an increase in acyl carnitines in the aging brain. (a) Many long chain fatty acids were decreased in aged naïve mice compared to young naïve mice. (b–e) Representative long chain fatty acids: (b) Stearate (18:0) (c) Oleate/vaccenate (18:1) (d) Eicosapentaenoate (EPA; 20:5n3) (e) Docosahexaenoate (DHA; 22:6n3) (f) Some, but not all, species of the medium and long chain acyl carnitines were increased in aged naïve mice compared to young naïve mice. (g–h) Representative acyl carnitines: (g) Myristoylcarnitine (h) Palmitoleoylcarnitine. (i) Neurofilament Light (NF-Light) levels were increased in the plasma of the aged naïve mice compared to young naïve mice and (j) A schematic illustration of transportation of fatty acids into mitochondria before metabolism. After crossing the cell membrane, free fatty acids are conjugated with coenzyme-A (CoA) to form fatty acyl-CoAs, which are subsequently combined with carnitine. The resulting acyl carnitines can cross the mitochondrial membrane, after which carnitine is released, and the newly formed fatty acyl CoAs proceed to β-oxidation. Bar graphs: *p < 0.05 by unpaired two-tailed t test with Welch’s correction, n = 5–6. Key for the heatmaps A&F: The numbers in the heatmaps indicate fold change with significance tested by Welch’s two-sample t test. Yellow- and red-shaded cells indicate p ≤ 0.05 (red indicates that the mean values are significantly higher, and yellow indicates that they are significantly lower). Light red- and light-yellow shaded cells indicate 0.05 < p < 0.10.

