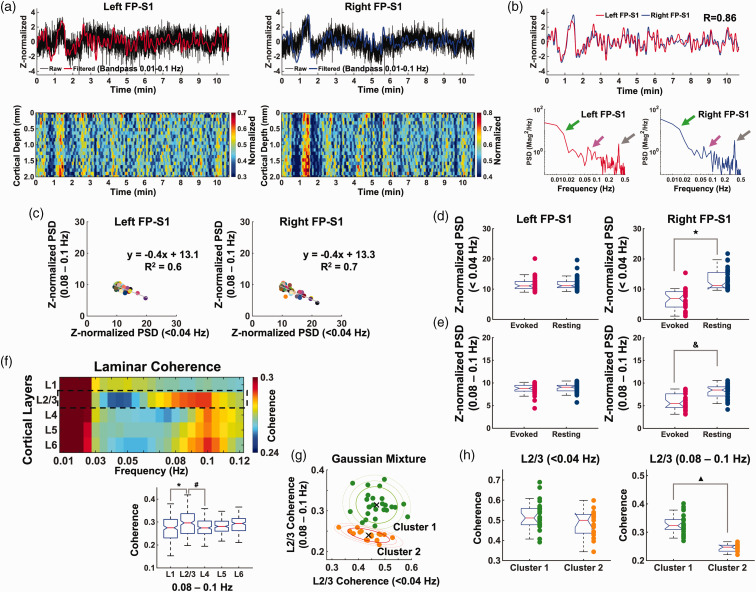
Figure 3.
Characteristics of laminar-specific coherences in rs-fMRI using BiLS method. (a) Top: Z-score normalized fMRI time series of raw (black) and filtered (red and blue) data (average of 20 voxels, 0–2 mm, bandpass: 0.01–0.1 Hz) in the left and right FP-S1 during rest (10 min 40 sec, one representative trial). Bottom: Normalized spatiotemporal maps showing the laminar-specific responses across the cortical depth in the same FP-S1 (0–2 mm, bandpass: 0.01–0.1 Hz). (b) Top: Z-score normalized fMRI time series of the filtered data from the same trial in the left and right FP-S1 marked in red and blue, respectively (correlation: 0.86). Bottom: The PSD analyses of the Z-score normalized time series in both the left and right cortices show obvious peaks at the ultra-slow oscillatory frequency (green arrow, <0.04 Hz), 0.08–0.1 Hz (magenta arrow) and ∼0.3–0.4 Hz (gray arrow). (c) Scatter plots of Z-normalized PSDs in the left and right FP-S1: ultra-slow oscillation (<0.04 Hz) vs. 0.08–0.1 Hz in Group 1 and 2. Individual dots represent trials. (d) Comparison of Z-normalized PSDs of ultra-slow oscillation (<0.04 Hz) in the evoked (red) and rs- (navy) fMRI of Group 1 and 2 (t-test: ★p < 10−10). (e) Comparison of Z-normalized PSDs of 0.08–0.1 Hz in the evoked (red) and rs- (navy) fMRI of Group 1 and 2 (t-test: &p < 10−7). (f–h) Average results of coherence from all data sets (n = 43 trials of 6 rats) (f) Top: Laminar-specific coherence across L1, L2/3, L4, L5, L6. Bottom: the average coherences (0.08–0.1 Hz) across the whole trials showing that L2/3 was significantly different from L1 and L4 (one-way ANOVA: p = 5.5 * 10−6, post-hoc: *p and #p < 0.05, Bonferroni correction). (g) Left: Scatter plot of the L2/3-specific coherence values with x-axis as the mean of coherence at <0.04 Hz and y-axis as the mean of coherence at 0.08–0.1 Hz to examine the dependence of the two different frequency bands. Right: By applying the Gaussian Mixture Model clustering with the L2/3 coherence values, all the 43 trials were divided into two groups. Cluster 1 (n = 26 trials) had relatively high averaged coherence values in both the frequency bands while Cluster 2 (n = 17 trials) had low averaged coherence values. ‘×’ signs indicate the centroid of the individual groups and (h) Cluster 1 and 2 show no significant difference at <0.04 Hz (left, independent t-test, p = 0.0805) while significant difference at 0.08–0.1 Hz (right, independent t-test, ▲ p = 7.5853*10−12).

