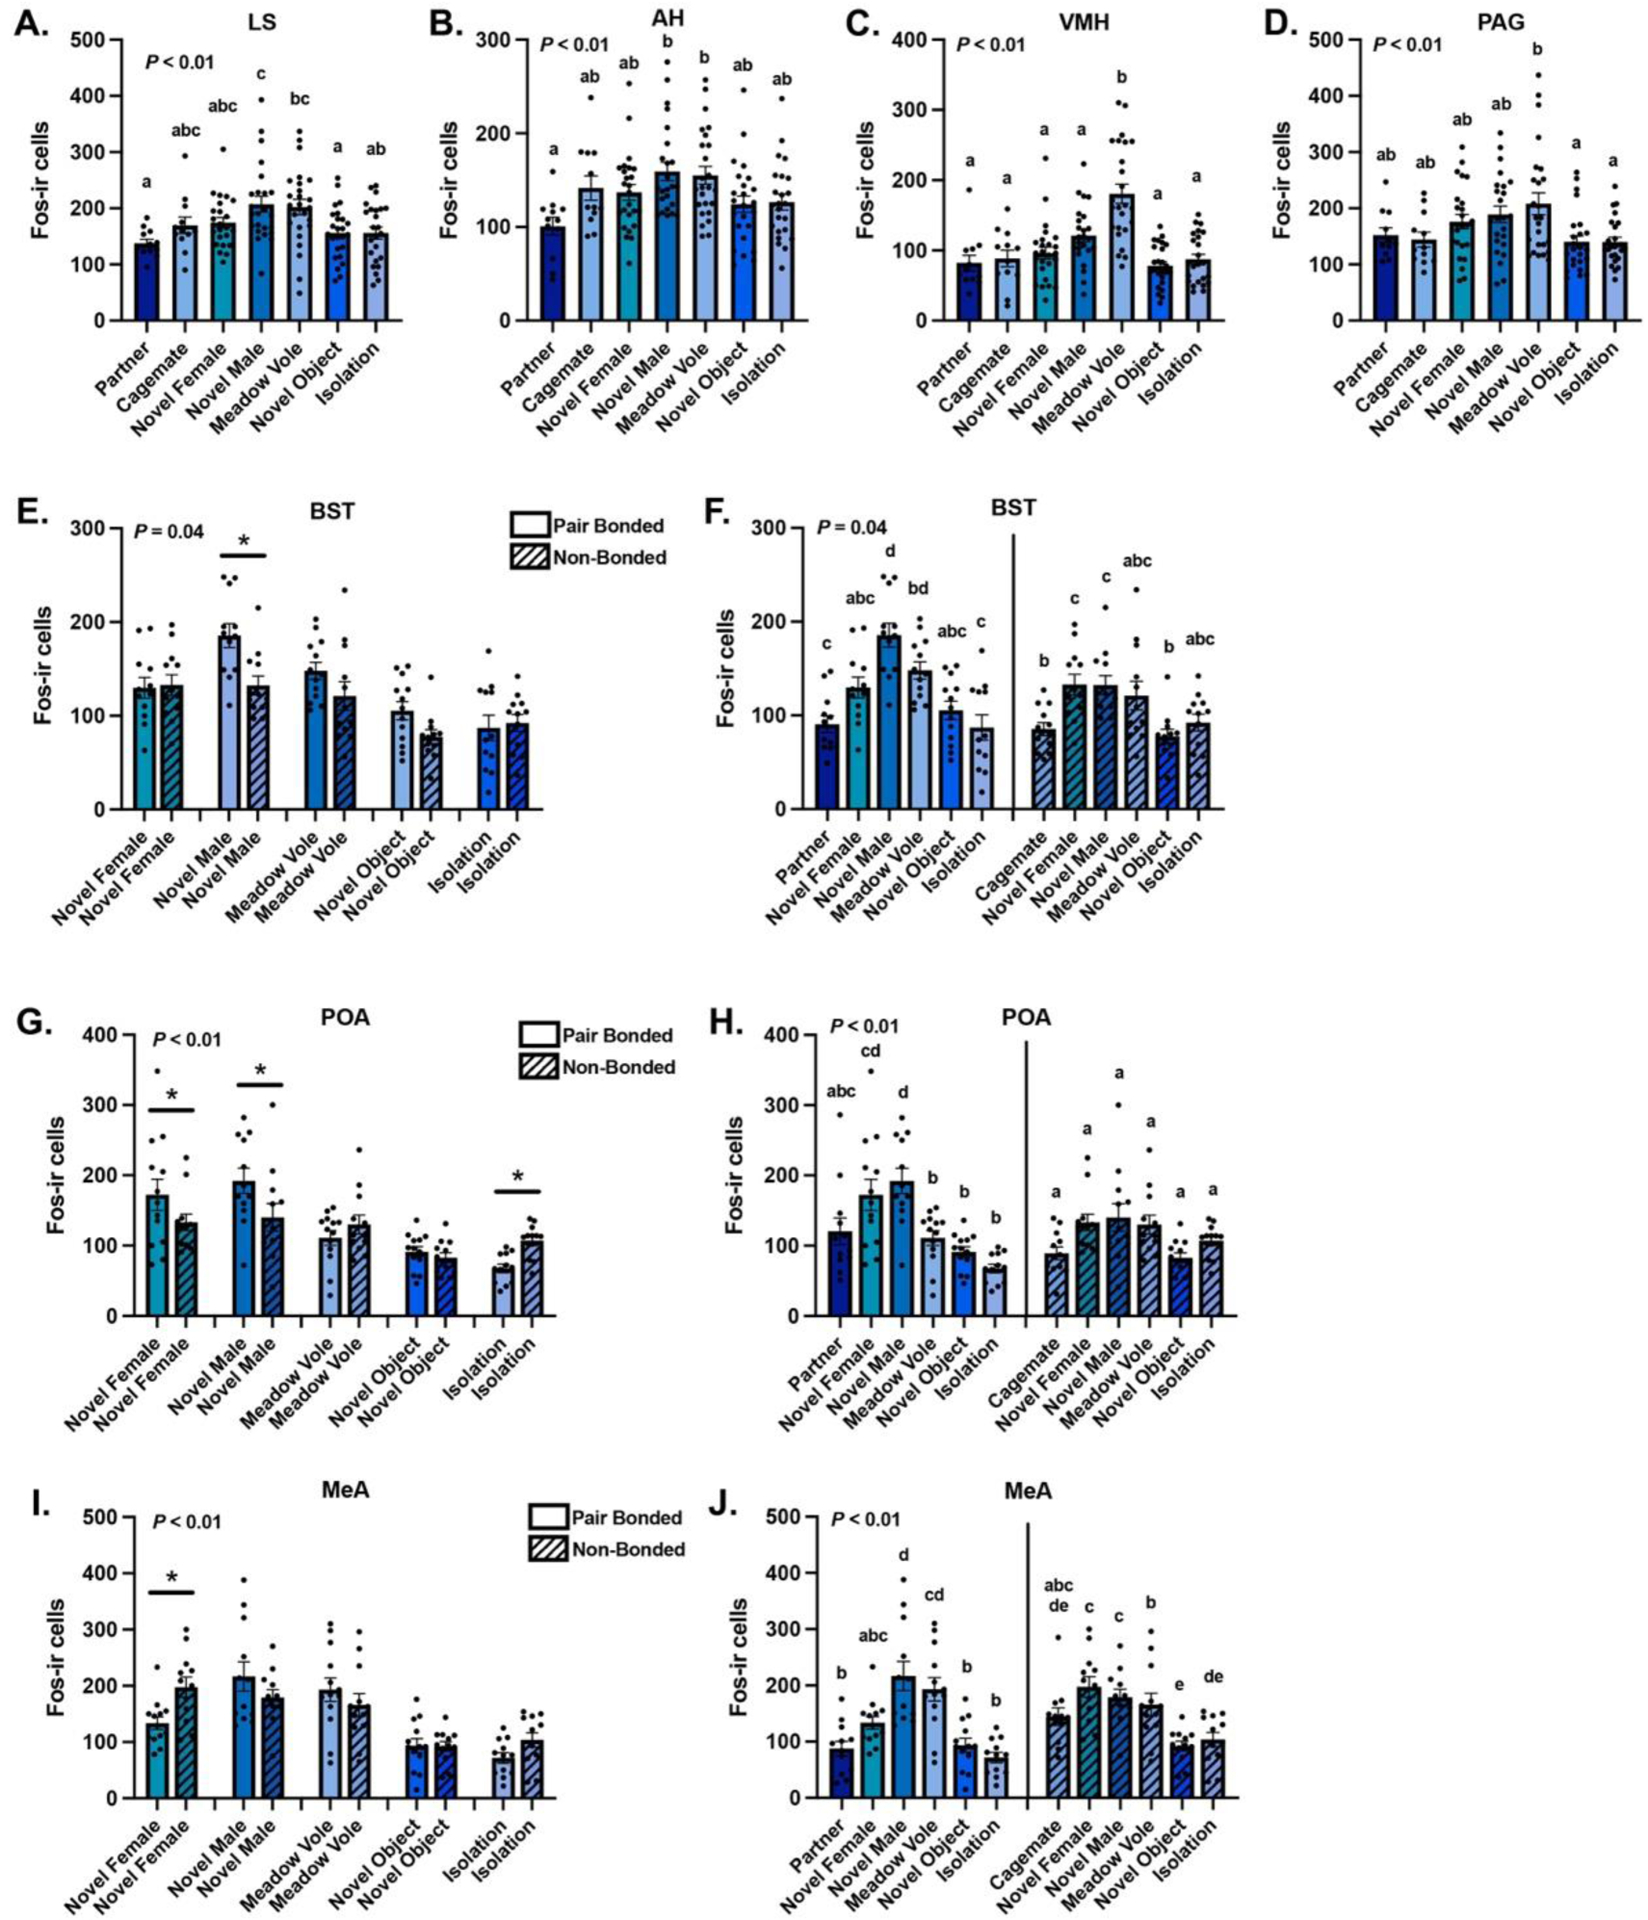
Figure 3. GLM analysis of brain region-specific Fos expression.

Mean ± SEM Fos-ir expression across contexts in the (A) lateral septum (LS), (B) anterior hypothalamus (AH), (C) ventromedial hypothalamus (VMH), and (D) periaqueductal gray (PAG). Mean ± SEM Fos-ir expression interactions between Group and Context in the (E-F) bed nucleus of the stria terminalis (BST), (G-H) preoptic area (POA), and (I-J) medial amygdala (MeA). Dots represent individual data points. Asterisks indicate statistical significance. Shared letters over bars represent statistical similarity whereas different letters over bars indicate statistically significant differences.
