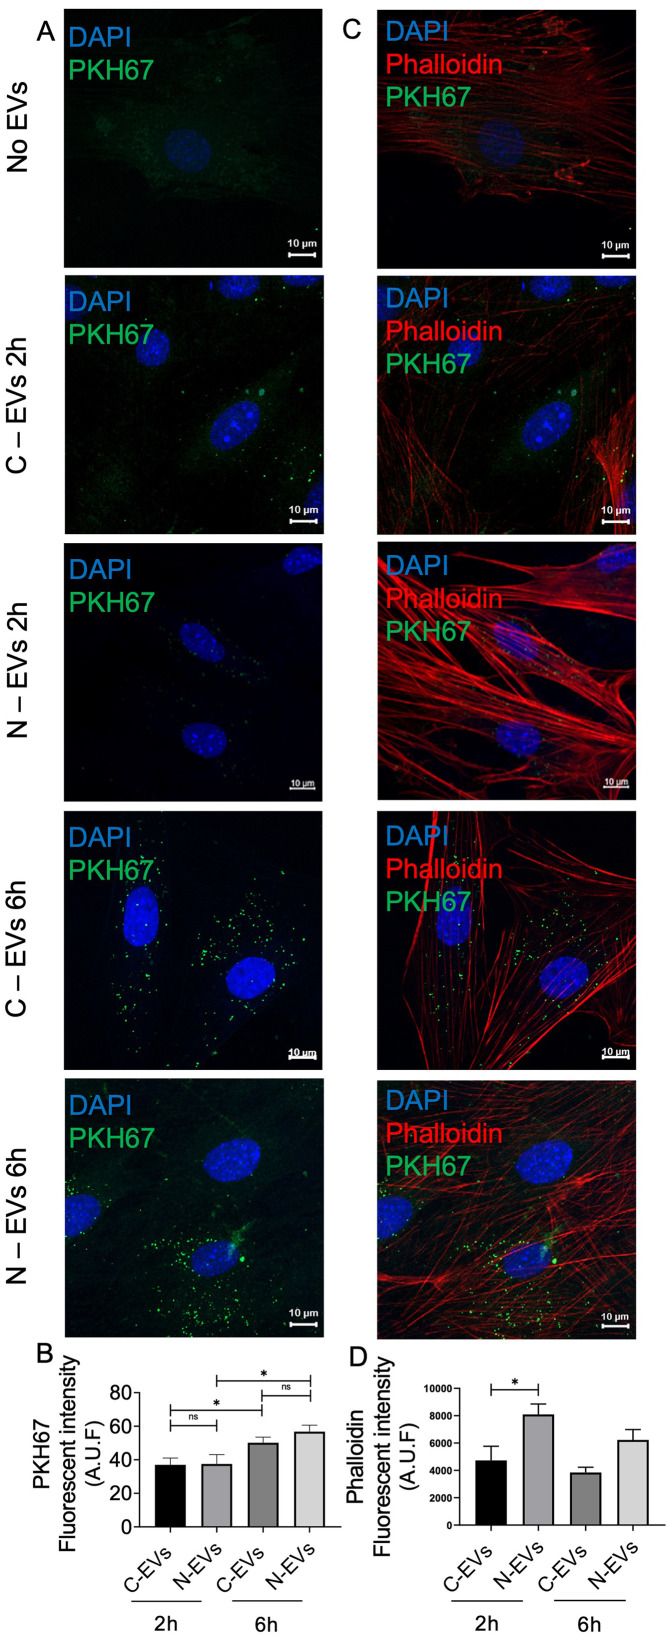
Figure 4.
Müller derived-EVs uptake in Müller cells culture. (A, B) Representative images of Müller cell cultures treated for 2 and 6 h with no EVs or with 30 μg/mL of control (C-EVs) or NMDA EVs (N-EVs), that were pre-stained with the fluorescent green dye PHK67. C-EVs: EVs derived from control Müller cells, N-EVs: EVs derived from NMDA-treated Müller cells. Cell nuclei were labeled with 4,6-diamino-2-phenylindole (DAPI) in blue. Objective 63X, scale bars, 10 µm. (B) The graph shows the fluorescence intensity of the green-labeled EVs inside muller cells that was quantified from eight images of four independent experiments using ImageJ software. The values on the graph represents the mean fluorescence of all the images per condition. Statistical significance was determined by an unpaired Student´s t-test. *p < 0.05. (C) Representative images of Müller cells in co-culture with control or NMDA EVs for 2 and 6 h. An increase in the intensity of rhodamine-phalloidin (red) in control Müller cells is evident after the exposure to NMDA EVs for 2 h. Objective 63X, scale bars, 10 µm. (D) The graph shows the fluorescence intensity of the red-labeled rhodamine-phalloidin in muller cells. It was quantified from five images of four independent experiments (at least 50 cells per condition) by ImageJ software. The values on the graph represents the mean fluorescence of all the images per condition. Statistical significance was determined by an unpaired Student´s t-test. *p < 0.05.

