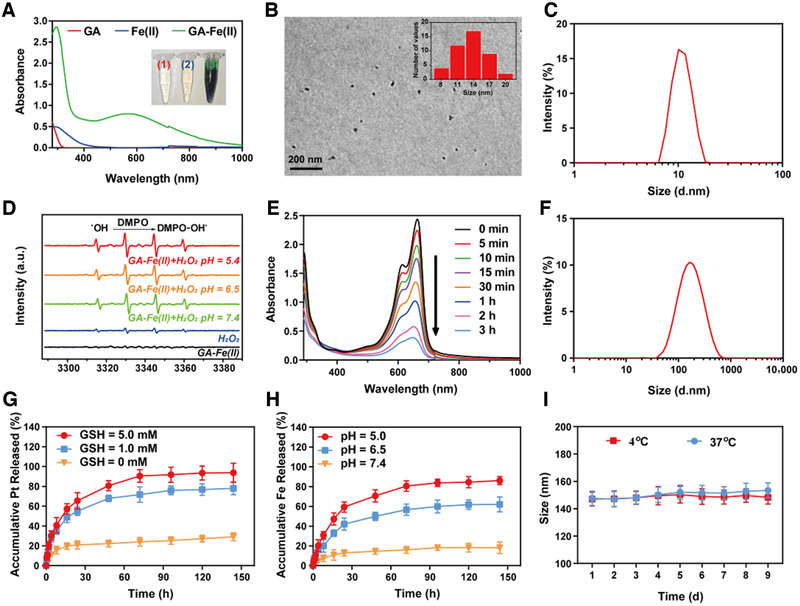
FIGURE 2.

Fabrication and characterization of Pt/GF@Lipo‐TPP. (A) Schematic illustration of synthetic process regarding Pt/GF@Lipo‐TPP. (B) TEM imaging of GA‐Fe(II) nanocomposites and corresponding size distribution (inset). (C) DLS analysis of GA‐Fe(II) nanocomposites. (D) ESR spectra of GA‐Fe(II) at different pH values. (E) The UV–vis–NIR spectrum of MB degradation induced by GA‐Fe(II) nanocomposites in a time‐dependent manner. (F) Size distribution of Pt/GF@Lipo‐TPP by DLS analysis. (G) The release profile of Pt from Pt/GF@Lipo‐TPP in the absence and presence of GSH. (H) The release profile of Fe from Pt/GF@Lipo‐TPP at different pH values. (I) Size change of Pt/GF@Lipo‐TPP at 4 and 37°C
