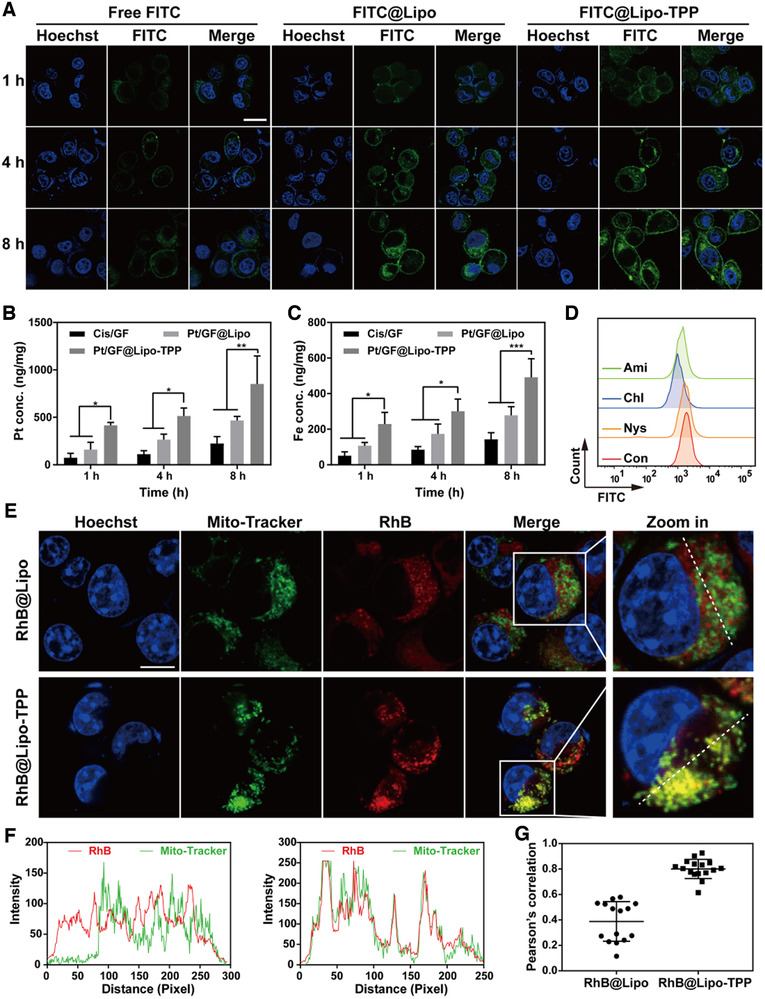
FIGURE 3.

The intracellular fate of Pt/GF@Lipo‐TPP in 4T1 cells. (A) The cellular uptake measured by CLSM images of 4T1 tumor cells treated with free FITC, FITC@Lipo, and FITC@Lipo‐TPP for 1, 4, and 8 h, respectively. Scale bars = 20 μm. (B and C) The intracellular concentration of Pt (B) and Fe (C) after cells incubated with different formulations for different durations. (D) Flow cytometer analysis of 4T1 cells pretreated with different endocytic inhibitors including Nys, Chl, and Ami. (E) Colocalization of mitochondria with RhB@Lipo or RhB@Lipo‐TPP by CLSM images. (F) The fluorescent intensity along the white dotted line in (E) analyzed by the Image J software. (G) The colocalization coefficient of mitochondria with RhB@Lipo or RhB@Lipo‐TPP on the basis of CLSM images
