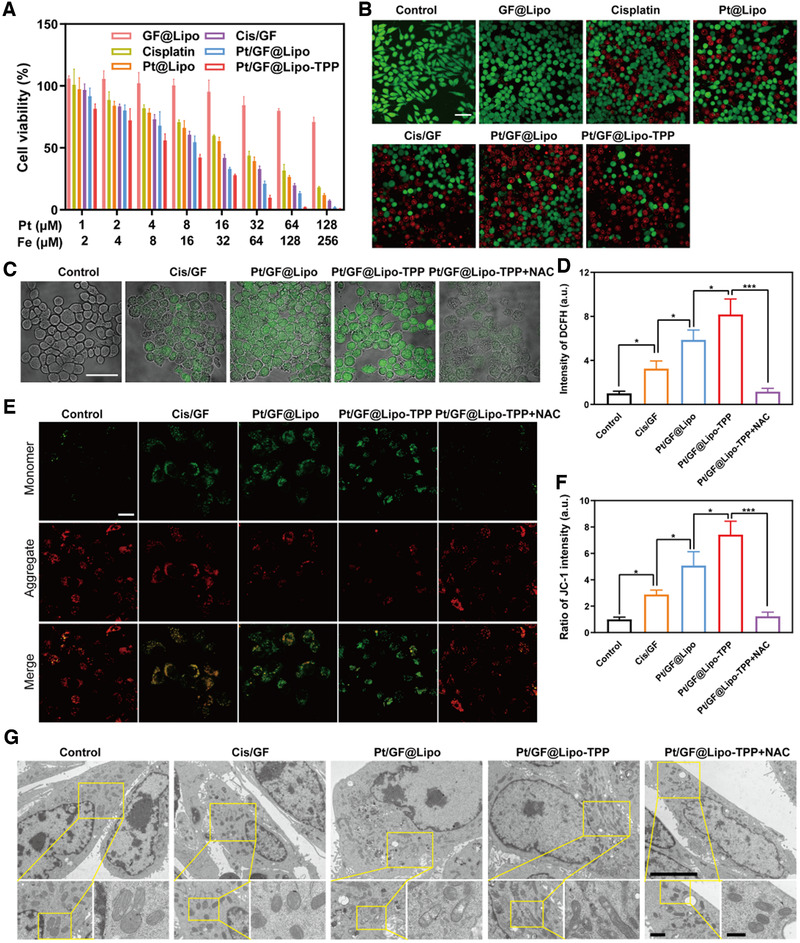
FIGURE 4.

Amplification of oxidative stress by Pt/GF@Lipo‐TPP in mitochondria. (A) Cell viability of 4T1 cells incubated with various treatments for 24 h. (B) CLSM images of 4T1 tumor cells stained with calcein‐AM/PI for 24 h. Scale bars = 50 μm. (C and D) The ROS level utilizing DCFH‐DA fluorescent dye after different treatments detected by CLSM (C) and flow cytometry (D). Scale bars = 50 μm. (E and F) Mitochondrial membrane potential using JC‐1 fluorescent probe by CLSM (E) and the corresponding green (monomer)/red (aggregate) fluorescent intensity ratio (F). (G) Mitochondria ultrastructure in 4T1 tumor cells after treatment with different formulations by Bio‐TEM at low (scale bars = 5 μm), middle (scale bars = 1 μm), and high (scale bars = 500 nm) magnifications, respectively
