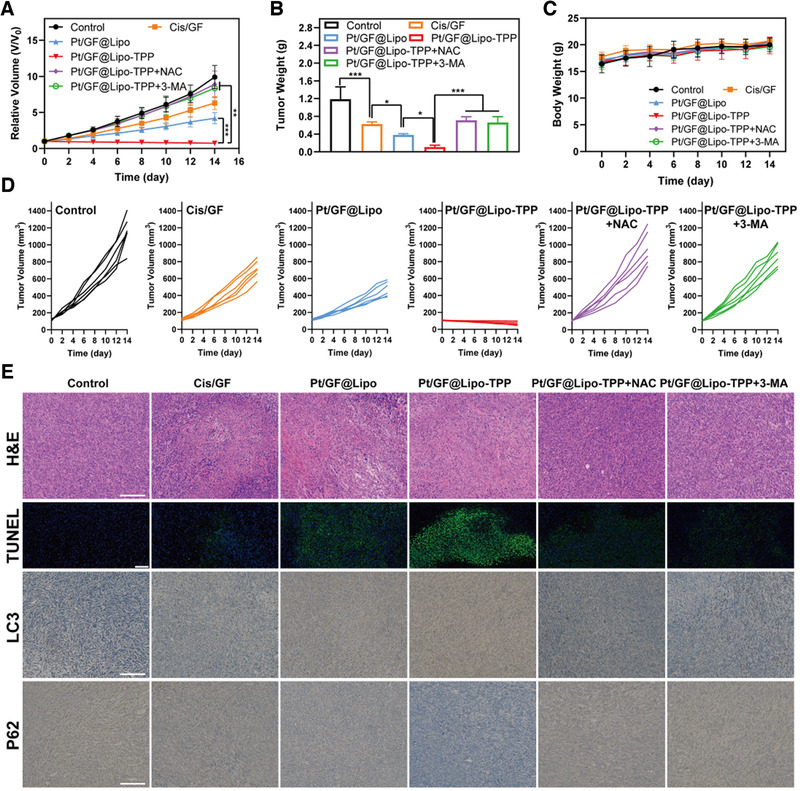
FIGURE 6.

In vivo therapeutic performance of Pt/GF@Lipo‐TPP. (A) Time‐dependent tumor‐growth curves of mice after various treatments. (B) Tumor weights of mice administrated with varied formulations at 14 days. (C) Time‐dependent body‐weight curves within 14 days. (D) Individual tumor growth curves of mice administrated with varied formulations. (E) Tumor sections were stained with H&E, TUNEL, LC3, and P62. Scale bars = 50 μm in H&E, LC3, and P62 images. NAC is a ROS scavenger and 3‐MA is an autophagy inhibitor. Scale bars = 100 μm in TUNEL images
