
FIGURE 3.
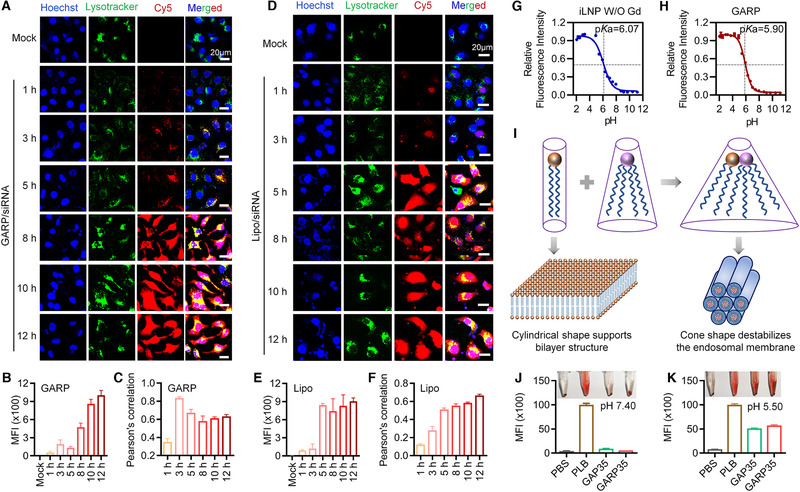
Intracellular trafficking of GARP35 iLNPs and pKa‐driven endosomal escape process in HepG2‐luc cells. (A–F) Confocal laser scanning microscopy (CLSM) imaging and quantitative analysis of HepG2‐luc cells transfected with GARP35/Cy5‐siRNA (A–C) and Lipo/Cy5‐siRNA (D–F) at indicated time points after transfection. (A and D) Confocal images of cells received the treatments of GARP35/Cy5‐siRNA (A) and Lipo/Cy5‐siRNA (D), respectively. (B and E) MFIs of GARP35/Cy5‐siRNA iLNPs (B) and Lipo/Cy5‐siRNA (E), respectively. (C and F) Pearson correlation analysis of (A) and (D), respectively. (G and H) pKa values calculated from the TNS fluorescence titration curves of iLNP W/O Gd NPs (G) and GARP NPs (H). (I) Proposed membrane destabilization mechanism of GARP iLNPs. (J and K) Results of hemolytic assay in vitro