
FIGURE 6.
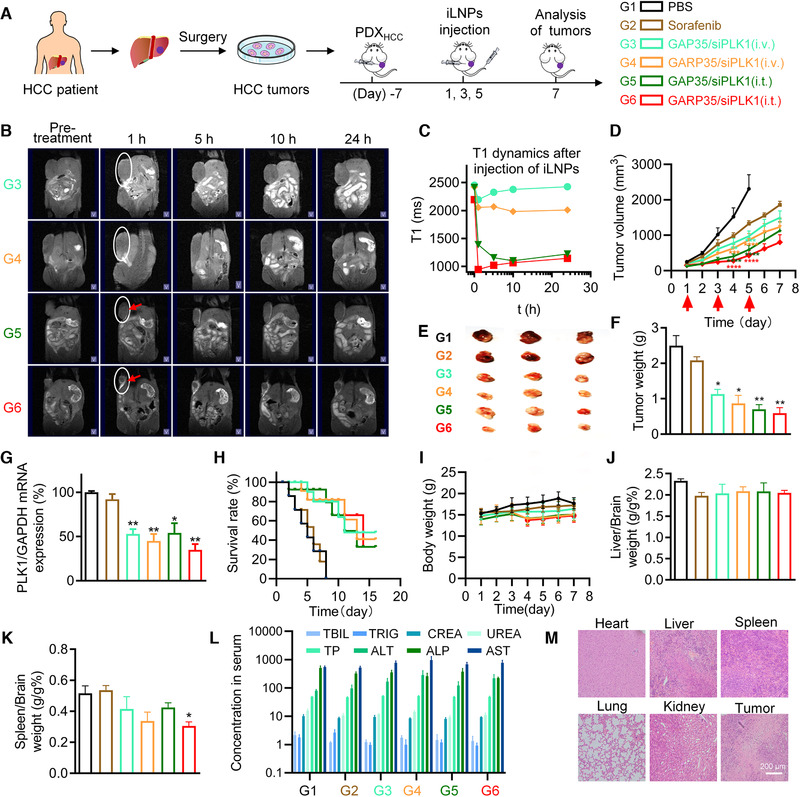
MRI and anticancer effects of iLNP formulations in PDX model. (A) Schematic illustration of the treatment protocol and grouping information. (B) MRI images acquired before administration and at 1, 5, 10, and 24 h after intravenous or intratumoral administration of lipid/siRNA formulations. The tumors were marked with white ellipse, and intratumorally treated tumors were indicated with red arrows. (C) Quantitative analysis of the tumor tissues shown in (B). (D) Tumor growth inhibition after treated with various formulations in PDX model. (E) Optical images of the tumors isolated on day 5. (F) Average tumor weights recorded on day 5. (G) Expression of PLK1 mRNA in tumor tissues. (H) Survival curves of the tumor‐bearing mice. (I) Body weights of the mice during the treatment course. (J and K) Organ coefficients of the liver (J) and the spleen (K), which were calculated by dividing the weight of the liver to the weight of the brain, and the weight of the spleen to the weight of the brain, respectively. (L) Serum biochemistry parameters examined at the end of experiment. (M) H&E staining of the main organs and the tumor tissue in the G4 group. Data were shown as the mean ± SEM. *P < 0.05, **P < 0.01, ***P < 0.001, ****P < 0.0001 vs PBS group