
FIGURE 4.
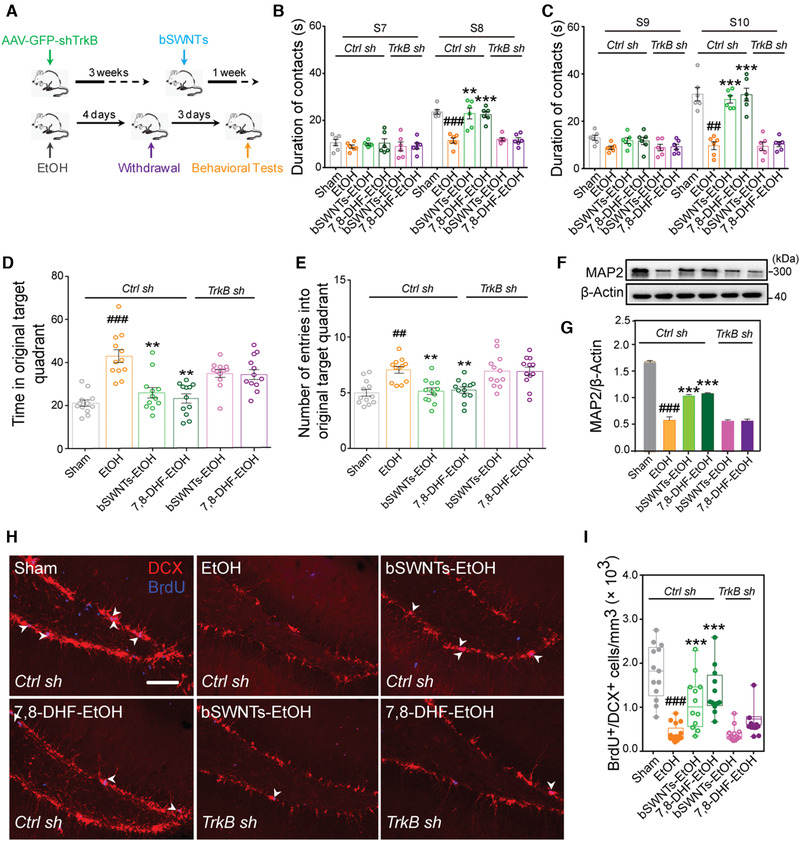
bSWNTs improve neurological function by TrkB. (A) Graphic illustration showing the timeline of TrkB knockdown, administration of bSWNTs, EtOH treatment and withdrawal, and behavioral tests. (B,C) Results from the novel location recognition test (B) and the novel object recognition test (C) to determine the effects of SWNTs and the specific TrkB agonist 7, 8‐DHF on learning and memory improvement in control, and TrkB knockdown rats. Data are presented as means ± SEM. ## p < 0.01, ### p < 0.001 versus the sham group; **p < 0.01, ***p < 0.001 versus EtOH group, one‐way ANOVA; n = 6. (D) Time in the original target quadrant in the Morris Water maze behavioral test, and (E) number of entries into the original target quadrant in the Morris water maze test, indicating that bSWNTs lost their ability to enhance memory recovery after TrkB knockdown. Data are presented as means ± SEM. ## p < 0.01, ### p < 0.001 versus the sham group; **p < 0.01 versus EtOH group, one‐way ANOVA; n = 8. (F) MAP2 expression detected by western blotting after TrkB knockdown. (G) Quantification of MAP2 expression in hippocampus. Data are presented as means ± SEM; ### p < 0.001 versus the sham group; ***p < 0.001 versus the EtOH group; n = 4 from 3 rats. (H) Double staining of DCX+/BrdU+ cells in hippocampus. White arrowheads indicate colocalization of DCX/BrdU staining. Scale bar, 50 μm. (I) Quantitative results from (H) indicating that TrkB knockdown also blocks the neural regeneration induced by administration of bSWNTs or 7,8‐DHF. Data are presented as means ± SEM. ### p < 0.001 versus the sham group; ***p < 0.001 versus EtOH group; n = 13 sham, n = 17 EtOH, n = 12 bSWNTs‐EtOH, n = 13 7,8‐DHF‐EtOH under Ctrl sh; n = 12 bSWNTs‐EtOH, n = 12 7,8‐DHF‐EtOH under shTrkB knockdown, from 5 rats per group