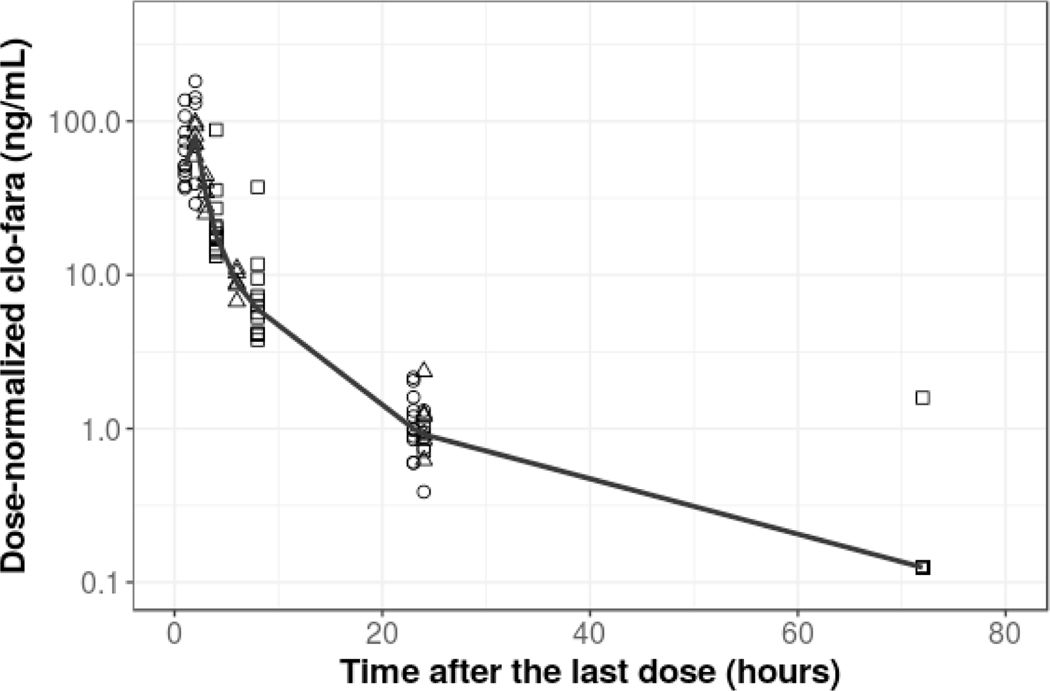
FIGURE 1.
Scatterplot of dose-normalized (by 10 mg/m2) plasma clo-fara concentration-time profiles. Black points represent the observed dose-normalized clo-fara concentrations from the different dose regimens: 10mg/m2(open circles), 30mg/m2(open triangles) and 40mg/m2(open squares). The black solid line represents the median values of the observed concentrations.

