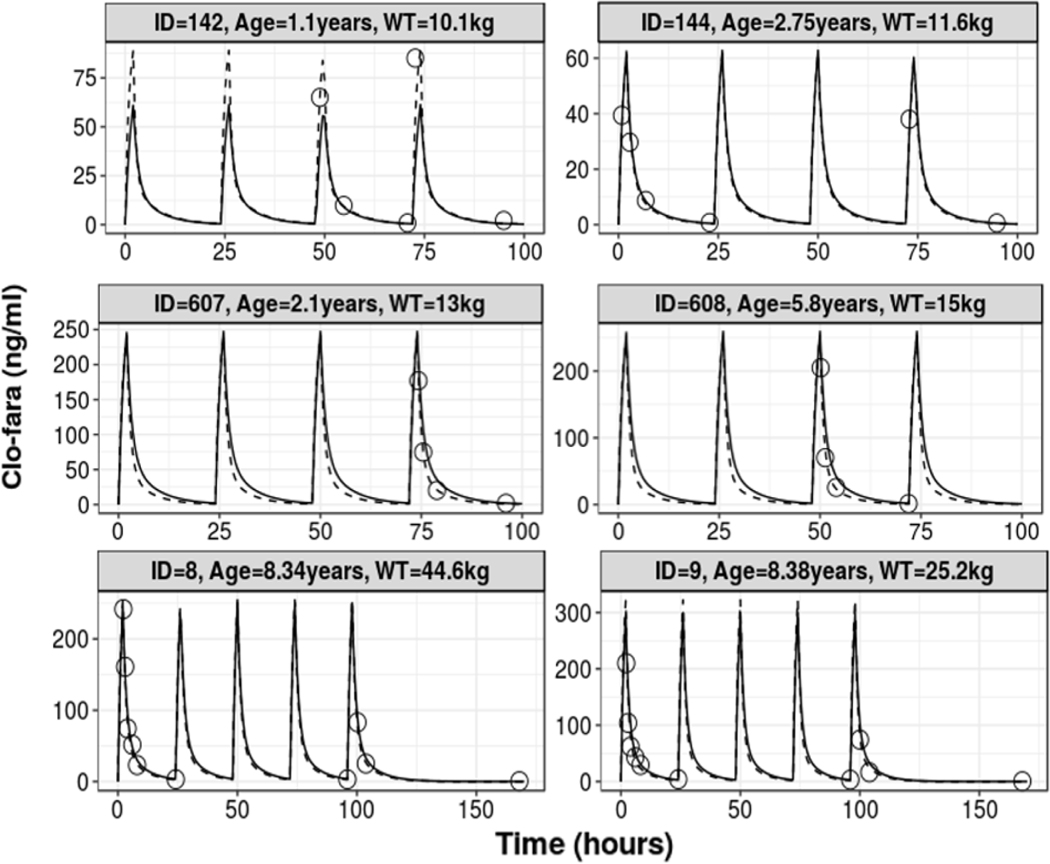
FIGURE 3.
Representative individual fit plots of observed and predicted time-concentration data of for the different dosing regimens: 10mg/m2(top row), 30mg/m2(middle row) and 40mg/m2(bottom row). Open circles represent the observed concentrations, black solid line is the population prediction, and the dashed line is individual prediction.

