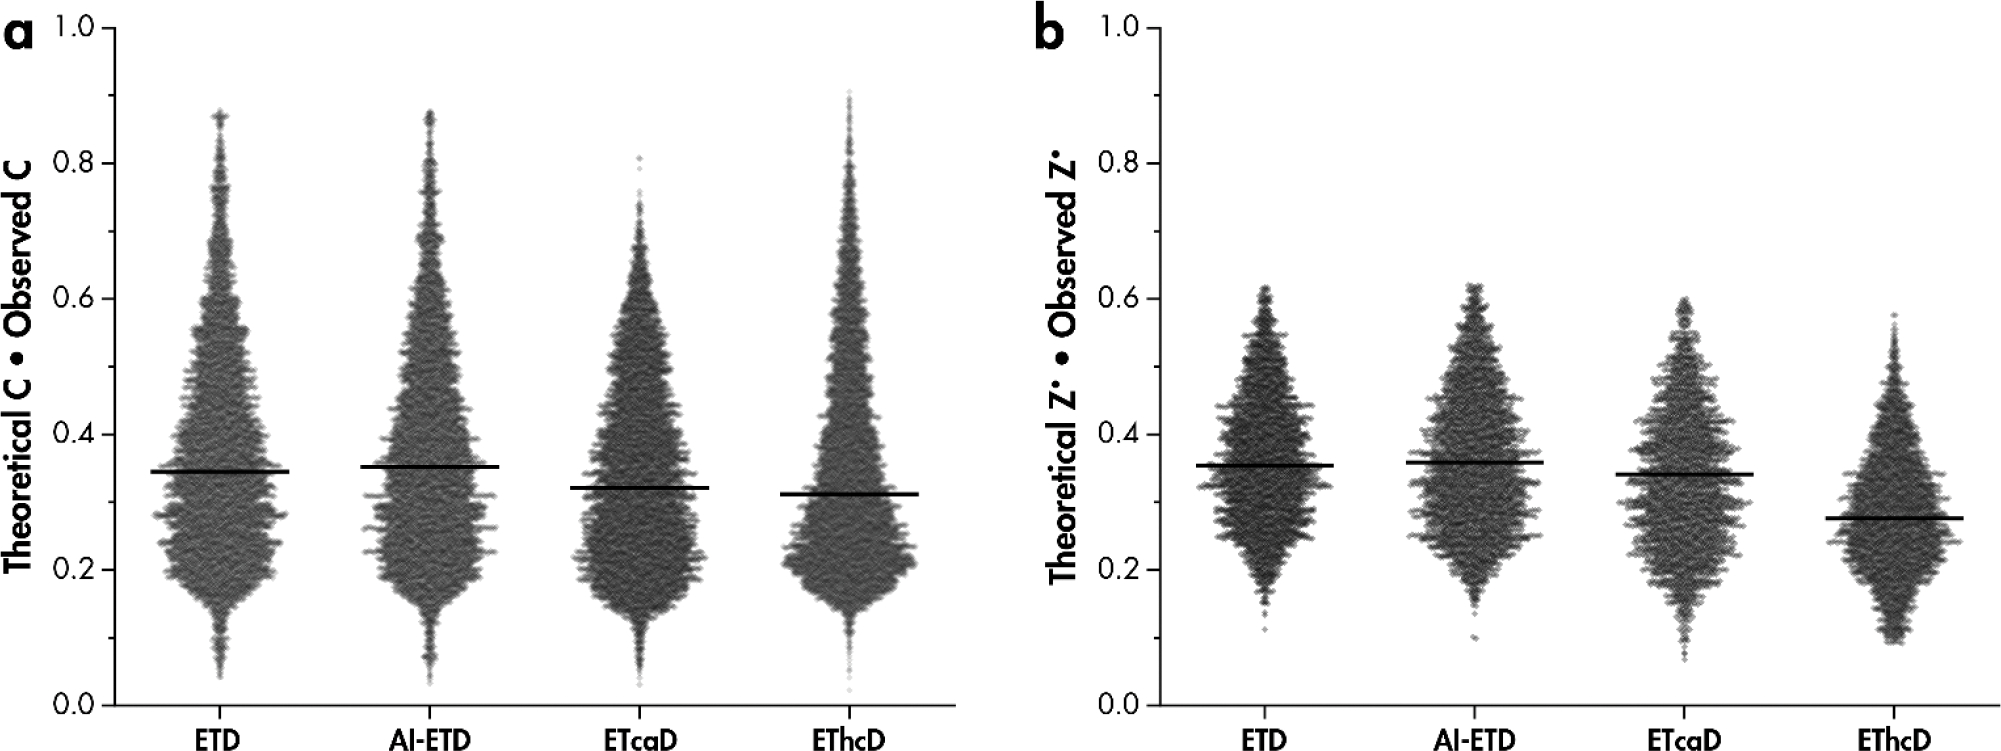
Figure 4: Comparison of observed and theoretical isotopic distributions reveals more distortion of isotopic distributions in ETcaD and EThcD spectra.

Dot product of the theoretical monoisotopic peak intensity and observed monoisotopic peak intensity for a) c-type and b) z•-type product isotopic distributions. Both theoretical and observed monoisotopic peak intensities are normalized to the total intensity of the first three isotopic peaks for z•-type fragments and include the [c+H]• peak for c-type fragments. Black bars are median values.
