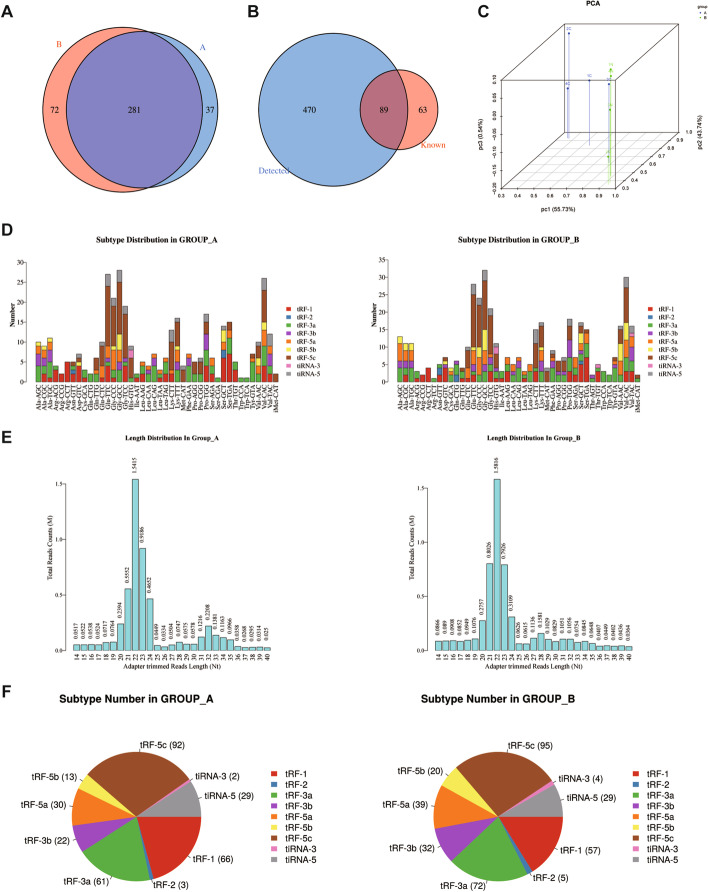
Fig. 1.
Characteristics of tsRNA profiles in LSCC samples (Group A for non-tumor adjacent tissues, Group B for LSCC tissues). A Venn diagrams showed that 281 tsRNAs were co-expressed in both groups. B The Venn diagram shows the overlap number of tsRNAs found in the sequencing data and tRFdb. C Principal component analysis (PCA) showed a clear difference between groups A and B. D Stacked plots indicated the number of subtypes of tsRNAs derived from the same anti-codon tRNA in the two groups. E The bar chart of sequence read length distribution revealed the read counts and the read length for each unique read in LSCC in two groups. F Pie charts show the subtype number of tsRNAs in the two groups

