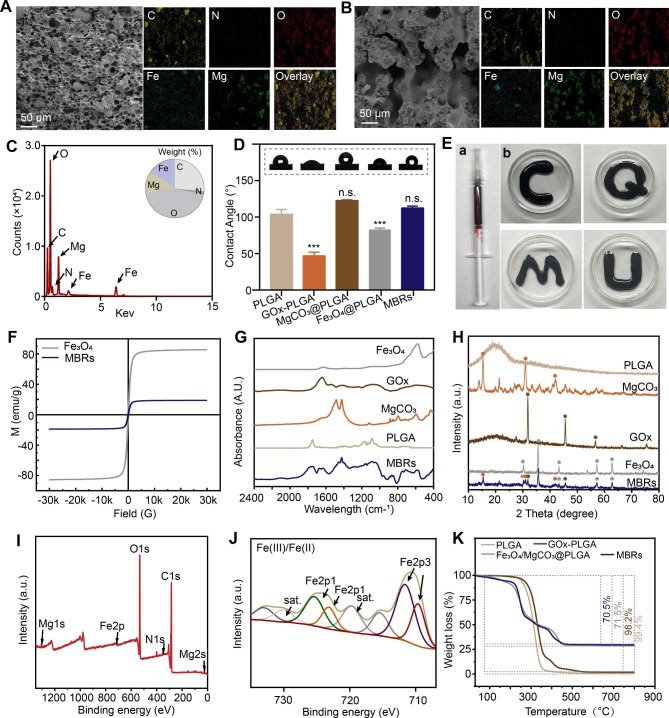
Fig. 1.
Fabrication and characterization of various forms of MBRs: Fe3O4/GOx/MgCO3@PLGA gels. SEM images and corresponding mapping images of MBRs without (A) and with (B) AMF exposure. (C) Energy spectrum of MBRs (insert figure showing weight% analysis of elements). (D) WCA test results of different groups (insert: optical images). (E) Digital images of the injectable MBRs through a standard 1 ml syringe and representative images of different forms. (F) Magnetic hysteresis loop of MBRs and Fe3O4 nanoparticles. (G) FTIR spectra of PLGA, MgCO3, GOx, Fe3O4 and MBRs. (H) XRD spectra of PLGA, MgCO3, GOx, Fe3O4 and MBRs. (I) XPS spectra of MBRs. (J) Fe 2p XPS of MBRs. (K) TGA curves of PLGA, GOx-PLGA, Fe3O4/MgCO3@PLGA and MBRs.

