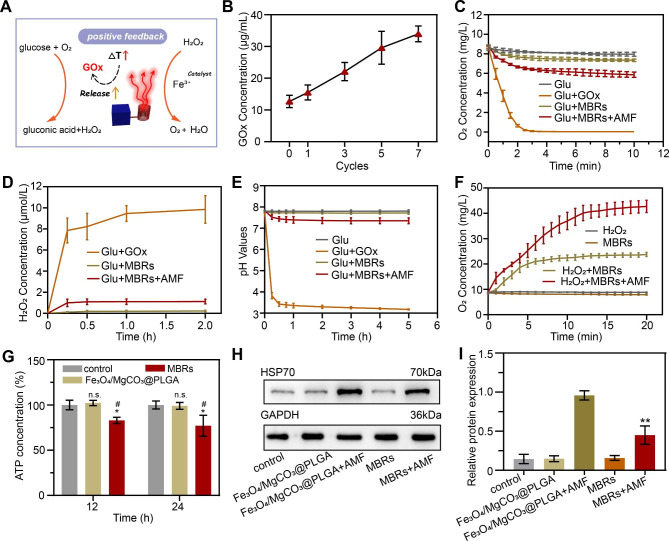
Fig. 3.
Mild hyperthermia-triggered GOx release to induce starvation therapy. (A) Schematic illustration of the mechanism of the mild hyperthermia-triggered GOx enzymatic reaction. (B) Release of GOx from MBRs after AMF exposure. (C) Oxygen concentration changes over time in different solutions of glucose, GOx + glucose, MBRs + glucose, and MBRs + AMF + glucose. (D) Changes in H2O2 concentration resulting from reactions with GOx + glucose, MBRs + glucose, and MBRs + AMF + glucose at various time points. (E) Changes in pH resulting from the reaction between glucose, GOx + glucose, MBRs + glucose, and MBRs + AMF + glucose at various time points. (F) Time-dependent curves of oxygen concentration for H2O2, MBRs, H2O2 + MBRs, and H2O2 + MBRs + AMF. (G) ATP concentration of 143B cells from different groups after AMF exposure. (H) Representative immunoblot results of different protein levels of HSP70 for each treatment group and (I) corresponding quantitative analyses of the ratios of HSP70/GAPDH. (The data are shown as the means ± SDs, n = 3 per group, n.s. represented no significance and *p < 0.05, **p < 0.01, in comparison with the control groups, ##p < 0.001 in comparison with Fe3O4/MgCO3@PLGA, respectively.)

