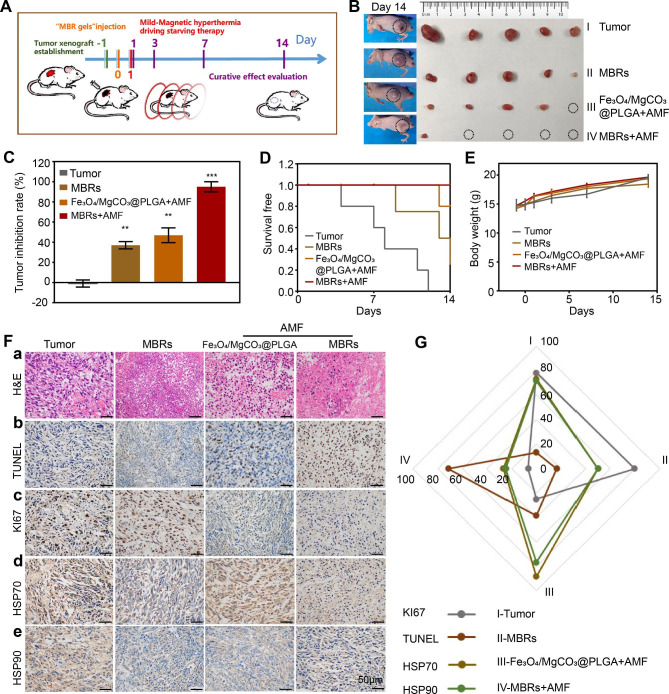
Fig. 5.
Antitumor therapeutic efficacy of MBRs. (A) Treatment and follow-up regimen. (B) Picture of the excised 143B tumors 14 days after treatments and the corresponding tumor-bearing mice. (C) Tumor inhibition rate of 143B tumor-bearing mice with the various treatments. (D) Morbidity-free survival and (E) body weight of 143B tumor-bearing mice in the different treatment groups. (F) H&E staining (a) and immunohistochemical staining (TUNEL-b, Ki67-c, Hsp70-d and Hsp90-e) in the tumor region of each group. (G) Quantitative analysis of immunohistochemical staining (Fig. 5-F). (Scale bars: 50 μm). (The data are shown as the means ± SDs, n = 5 per group, n.s. represented no significance and *p < 0.05, **p < 0.01, ***p < 0.001 in comparison with the control groups, respectively.)

