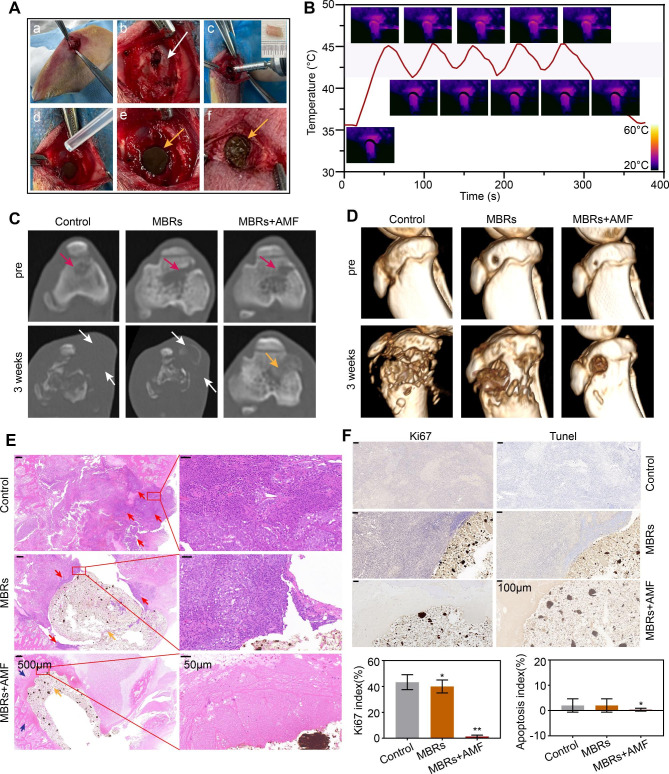
Fig. 7.
Evaluation of the MBRs anti-tumor ability for bone tumor in situ. (A) The processes of establishment of a residual tumor model after surgical treatment of tibial plateau bone tumors in rabbits (white arrow: postoperative bone defect, yellow arrows:MBRs). (B) Temperature-time curve of rabbit leg in MBRs group with AMF exposure for five on-off cycles and the corresponding infrared thermal images. (C) Axial position CT images at each follow-up time point of each group (red arrow: bone tumor in situ, white arrow:bone destruction and swelling of soft tissue, yellow arrow: injected solid form MBRs). (D) 3D-reconstructed CT images at each follow-up time point. (E) Histological evaluation of bone defect and bone tumor after treatment (scale bar is 500 μm and 50 μm, red arrow: bone tumor in situ, blue arrow: bone tissue after treatment, yellow arrow: injected solid form MBRs). (F) Immunohistochemical staining (Tunel and Ki67) in the tumor region of each group and corresponding quantitative analysis (Scale bars: 100 μm). (The data are shown as the means ± SDs, n = 5 per group, n.s. represented no significance and *p < 0.05, **p < 0.01 in comparison with the control groups, respectively.)

