
Figure 3. Emergence of Parietal Endoderm (PaE) Subpopulations within PE-like Epithelium.
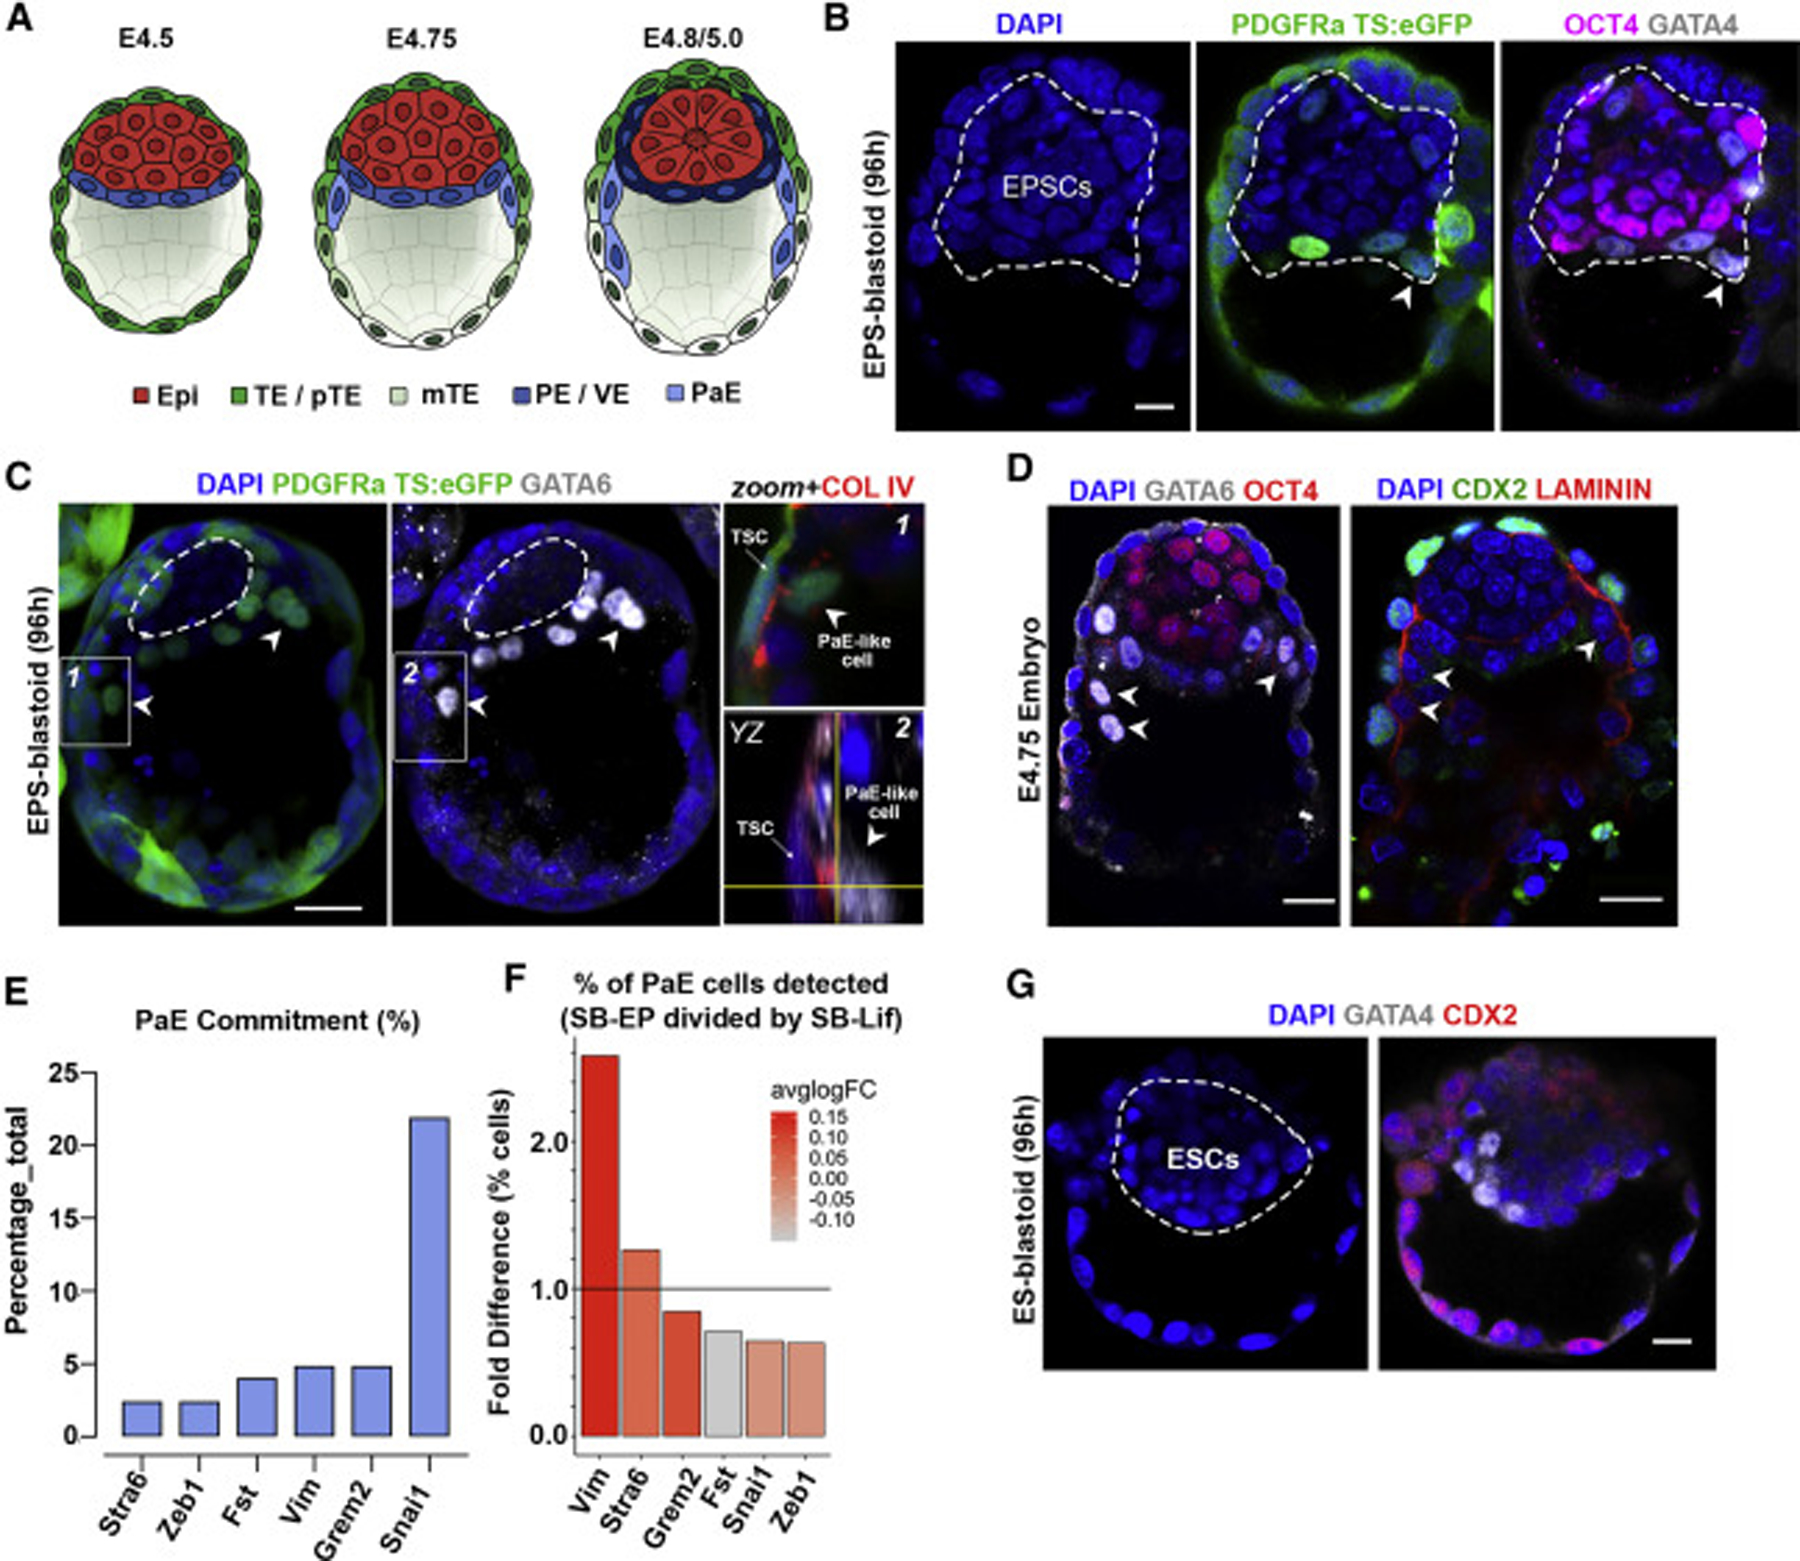
(A) Peri-implantation changes in blastocyst morphology. Emergence of primitive endoderm (PE; blue), PaE (light blue), and visceral endoderm (VE; dark blue). Epi, epiblast; TE, trophectoderm; pTE, polar TE; mTE, mural TE.
(B) EPS-blastoid with PDGFRa+ PaE-like cells.
(C) EPS-blastoid built from nuclear PDGFRa-H2B-GFP EPSCs and ubiquitous-eGFP TSCs. Arrowheads show PDGFRa and/or GATA6+ PaE-like cells extending along blastocoel cavity. Left and middle images show stack of 5 Z-planes. Boxed insets (labelled 1 and 2) on the right show Col IV (red) expression between PaE-cell and TSCs in single Z-plane. Orthagonal YZ view shown in inset 2 for better visualization.
(D) Natural E4.75 blastocyst showing early PaE formation (arrowheads).
(E) Percentage of cells expressing PaE-related genes as identified by sc-RNA-seq within the PE-like cell cluster in EPS-blastoids.
(F) The percentage and average expression levels of genes associated with PaE fate commitment within PE-like cell cluster in EPS-blastoids over ES-blastoids.
(G) Representative image of ESC-derived blastocyst in which there is no PaE formation.
Scale bars represent 20 μm in all panels.