
Figure 1.
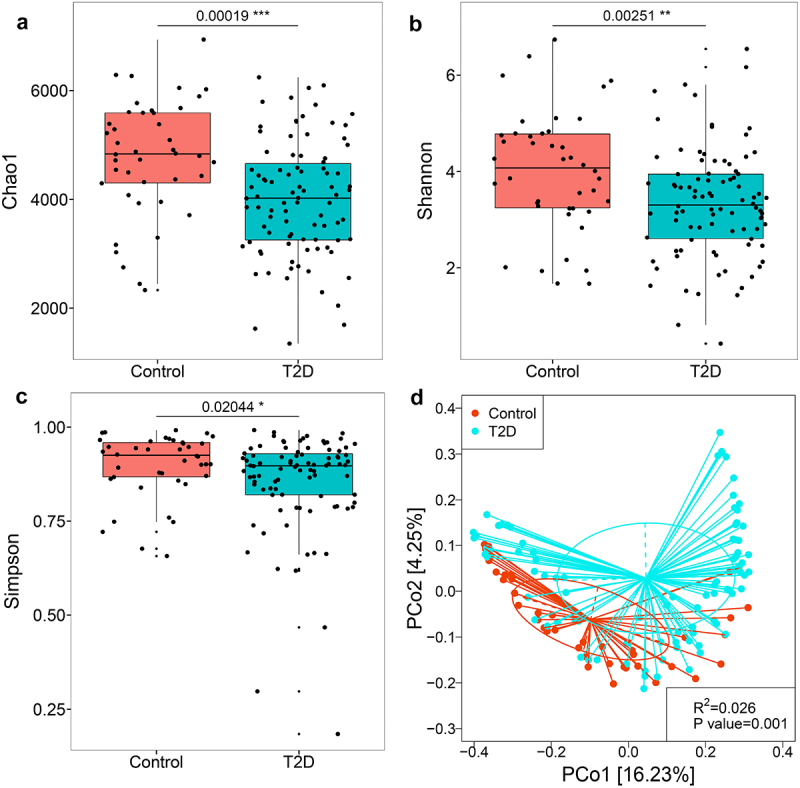
Alterations of the gut virome in T2D subjects compared with healthy controls. Differences between groups in viral richness based on the (a) Chao1 index and viral diversity based on the (b) Shannon and (c) Simpson indices at the contig level. For the box plots, the boxes extend from the first to the third quartile (25th to 75th percentiles), with the center line indicating the median. (d) PCoA analysis based on Bray-Curtis distance showing differences in gut viral community between T2D and healthy controls.