
Figure 9.
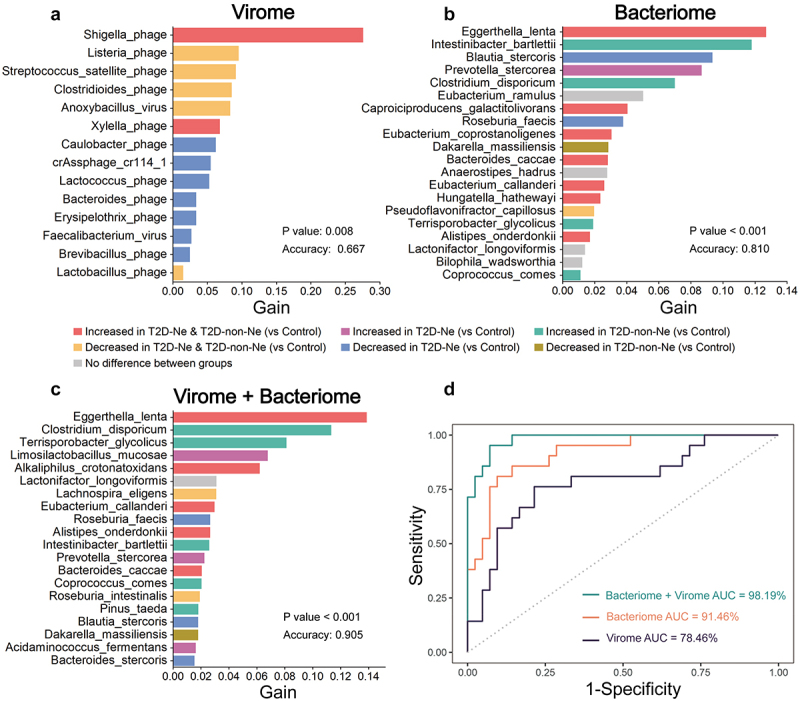
The combination of gut virome and bacteriome improves diagnostic performance in discriminating between T2D-Ne, T2D-non-Ne, and healthy controls based on the XGBoost model. The important features for (a) virome (only 14), (b) bacteriome (top 20), and (c) combined virome and bacteriome (top 20). Gain refers to the relative contribution of the feature to the model. The color of the bars corresponds to differential abundance between groups. (d) the ROC curve analysis for each of the three models, including their AUC values.