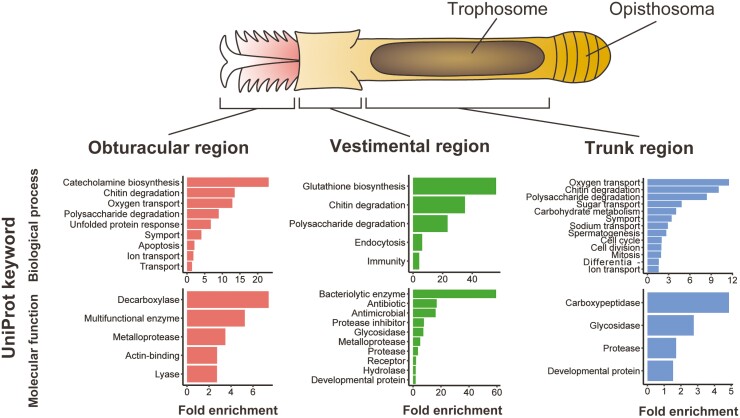
Figure 2.
Transcriptomic profiles of body regions of L. satsuma. The schematic drawing at the top shows the basic body structure of a ventimentiferan. The graph at the bottom shows results of the functional enrichment analysis of region-specific DEGs based on UniProt keywords. Keywords with P-values < 0.05 are shown.

