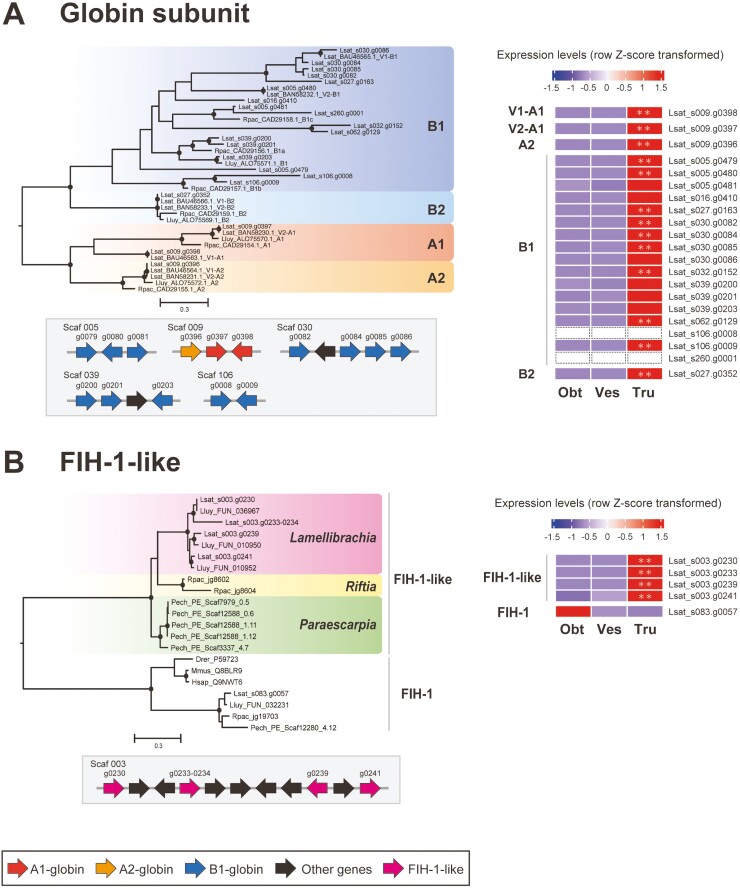
Figure 4.
Molecular phylogenetic tree, arrangement in the genome, and expression levels of globin, FIH-1, and FIH-1-like genes. (A) Globin subunit genes. The maximum likelihood phylogenetic tree was constructed using aligned and gap-trimmed amino acid sequences. A molecular phylogenetic tree of globin genes identified in gene models of four vestimentiferans is also shown in Supplementary Fig. S9A. For genes retrieved from NCBI GenBank, taxonomy, accession number, and definition are shown. Circles on branches indicate bootstrap values higher than 80%. Arrows indicate transcription directions of the genes. The heat map shows relative gene expression levels (row Z-score transformed). Expression of two B1-globin genes (Lsat_s106.g0008 and Lsat_s260.g0001) was not detected in any of the three regions. (B) FIH-1-like genes. The maximum likelihood phylogenetic tree was constructed using the aligned and gap-trimmed amino acid sequences. For genes retrieved from UniProt/SwissProt database, taxonomy and accession numbers are shown. The heat map shows relative gene expression levels (row Z-score transformed). Lsat, L. satsuma; Lluy, L. luymesi; Rpac, R. pachyptila; Pech, P. echinospica; Drer, Danio rerio; Mmus, Mus musculus; Hsap; Homo sapiens; A1-B2, globin A1-B2 chain (subunit); V1, V2, V1 and V2 haemoglobin; Obt, obturacular region; Ves, vestimental region; Tru, trunk region; **, region-specific DEGs (FDR < 0.01).

