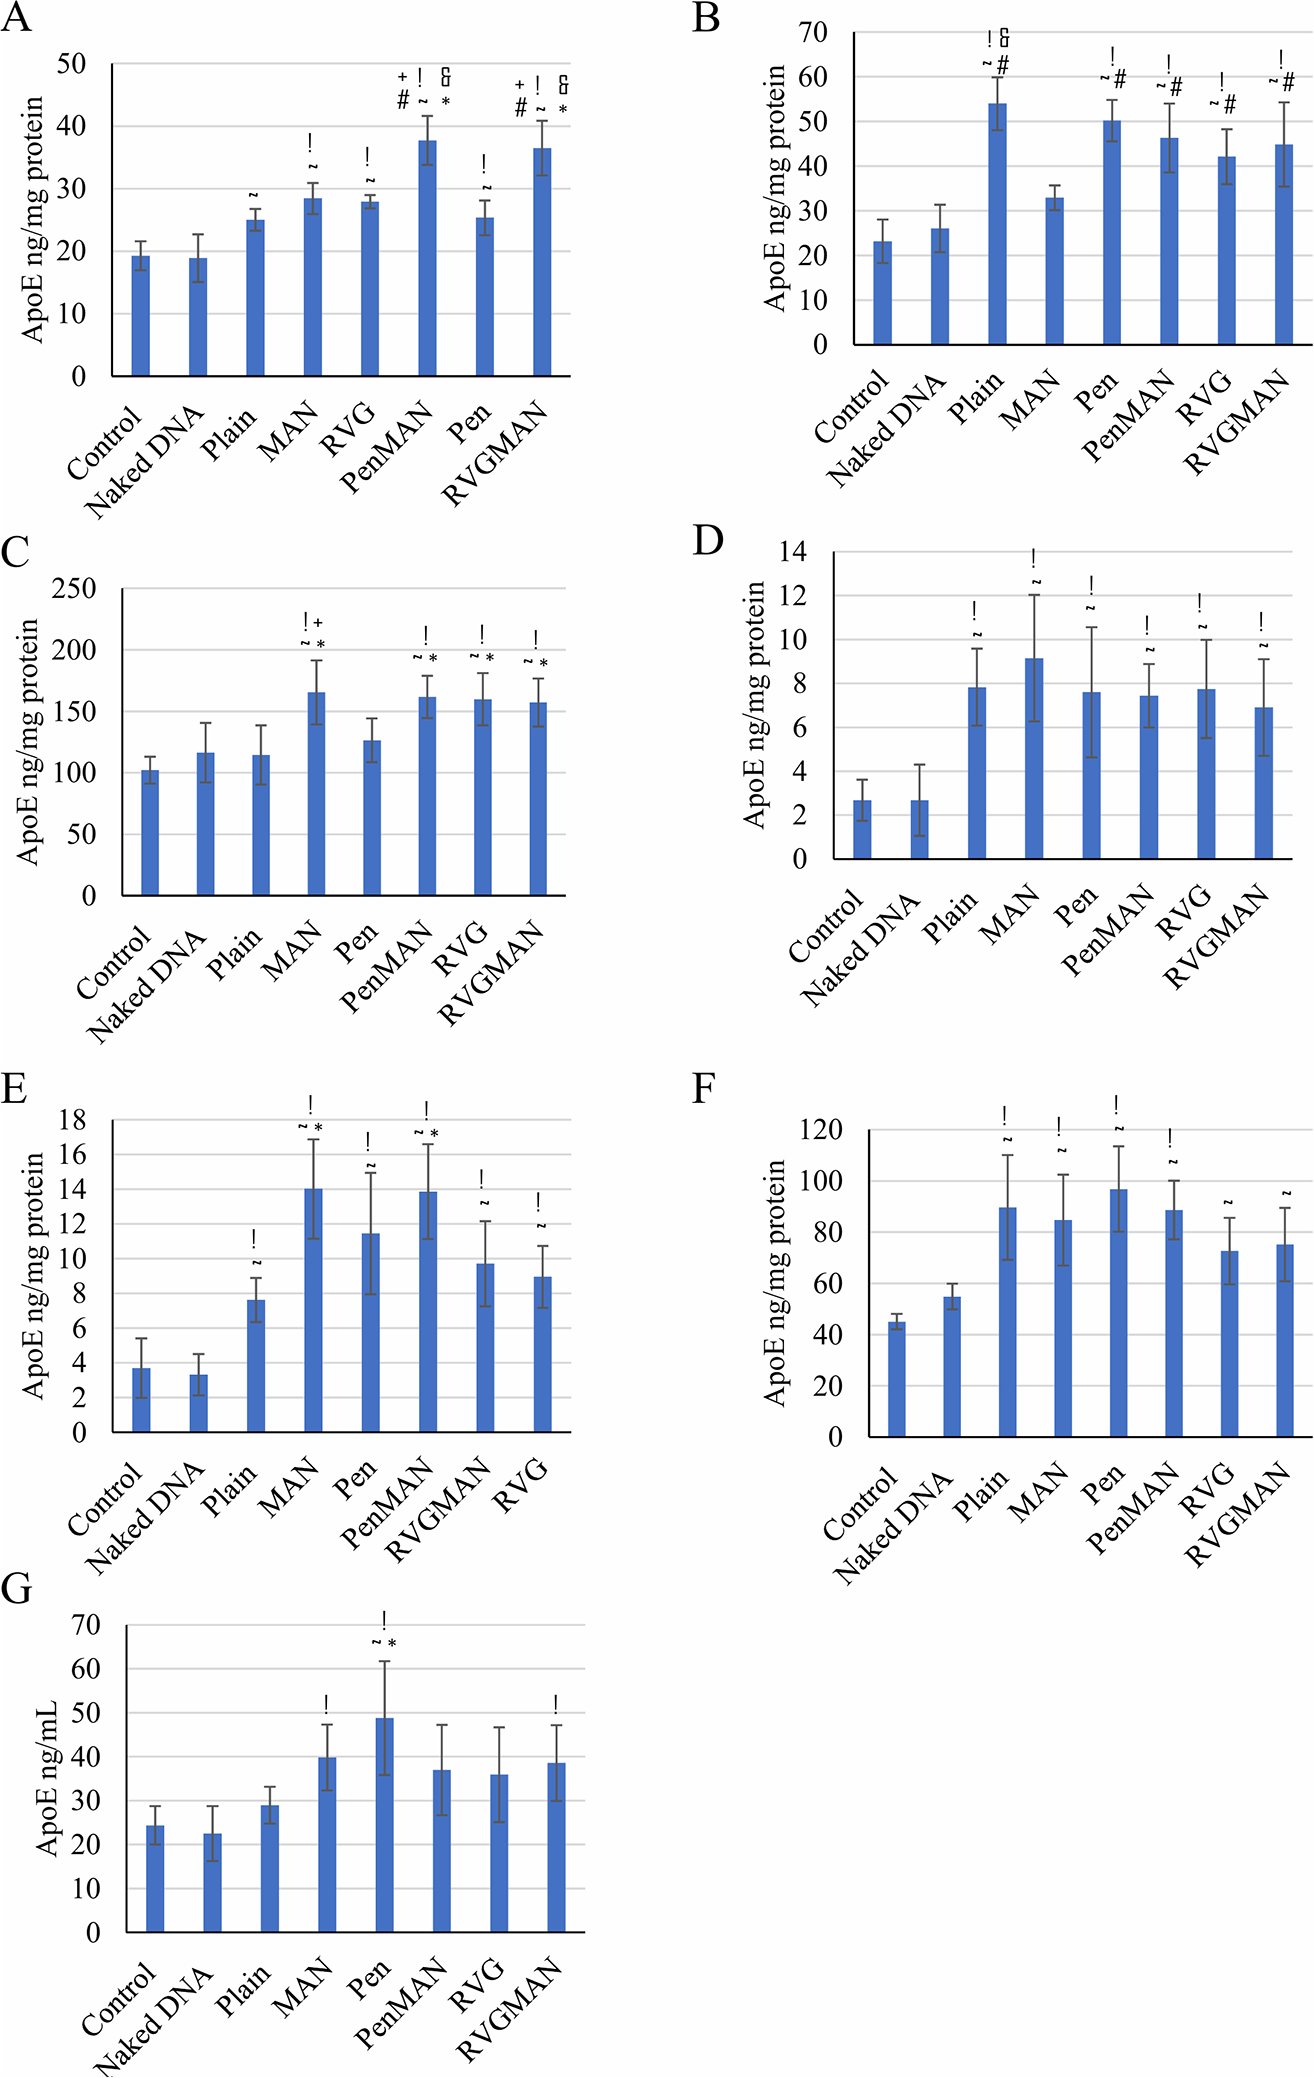
Figure 7.

ApoE concentration in various mouse tissues ((A) brain; (B) heart; (C) liver; (D) spleen; (E) lungs; (F) kidney; (G) plasma) following tail vein administration of pApoE2/chitosan loaded liposomes (15.2 nM of total lipids containing 1 μg pApoE2/g body weight). Data represent mean ± SD of four replicates. *, #, +, &, !, and ~ indicate statistically (p < 0.05) different from plain, MAN, Pen, RVG liposomes, naked DNA, and control, respectively.
