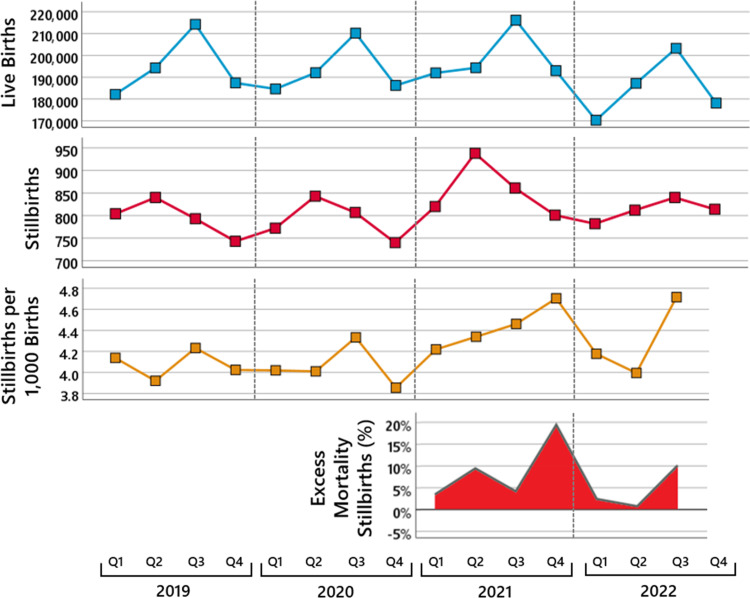
Figure 6. Stillbirths in the years 2019 to 2022 in Germany.
The first panel shows the number of live births per quarter from 2019 to 2022, the second panel the number of stillbirths per quarter from 2019 to 2022, the third panel the number of stillbirths per 1,000 total births (sum of the number of stillbirths in a quarter and the number of live births in the following quarter) per quarter from 2019 to 2022, and the fourth panel the quarterly increase in the number of stillbirths per 1,000 total births in the years 2021 and 2022 compared to the mean across the years 2019 and 2020.

