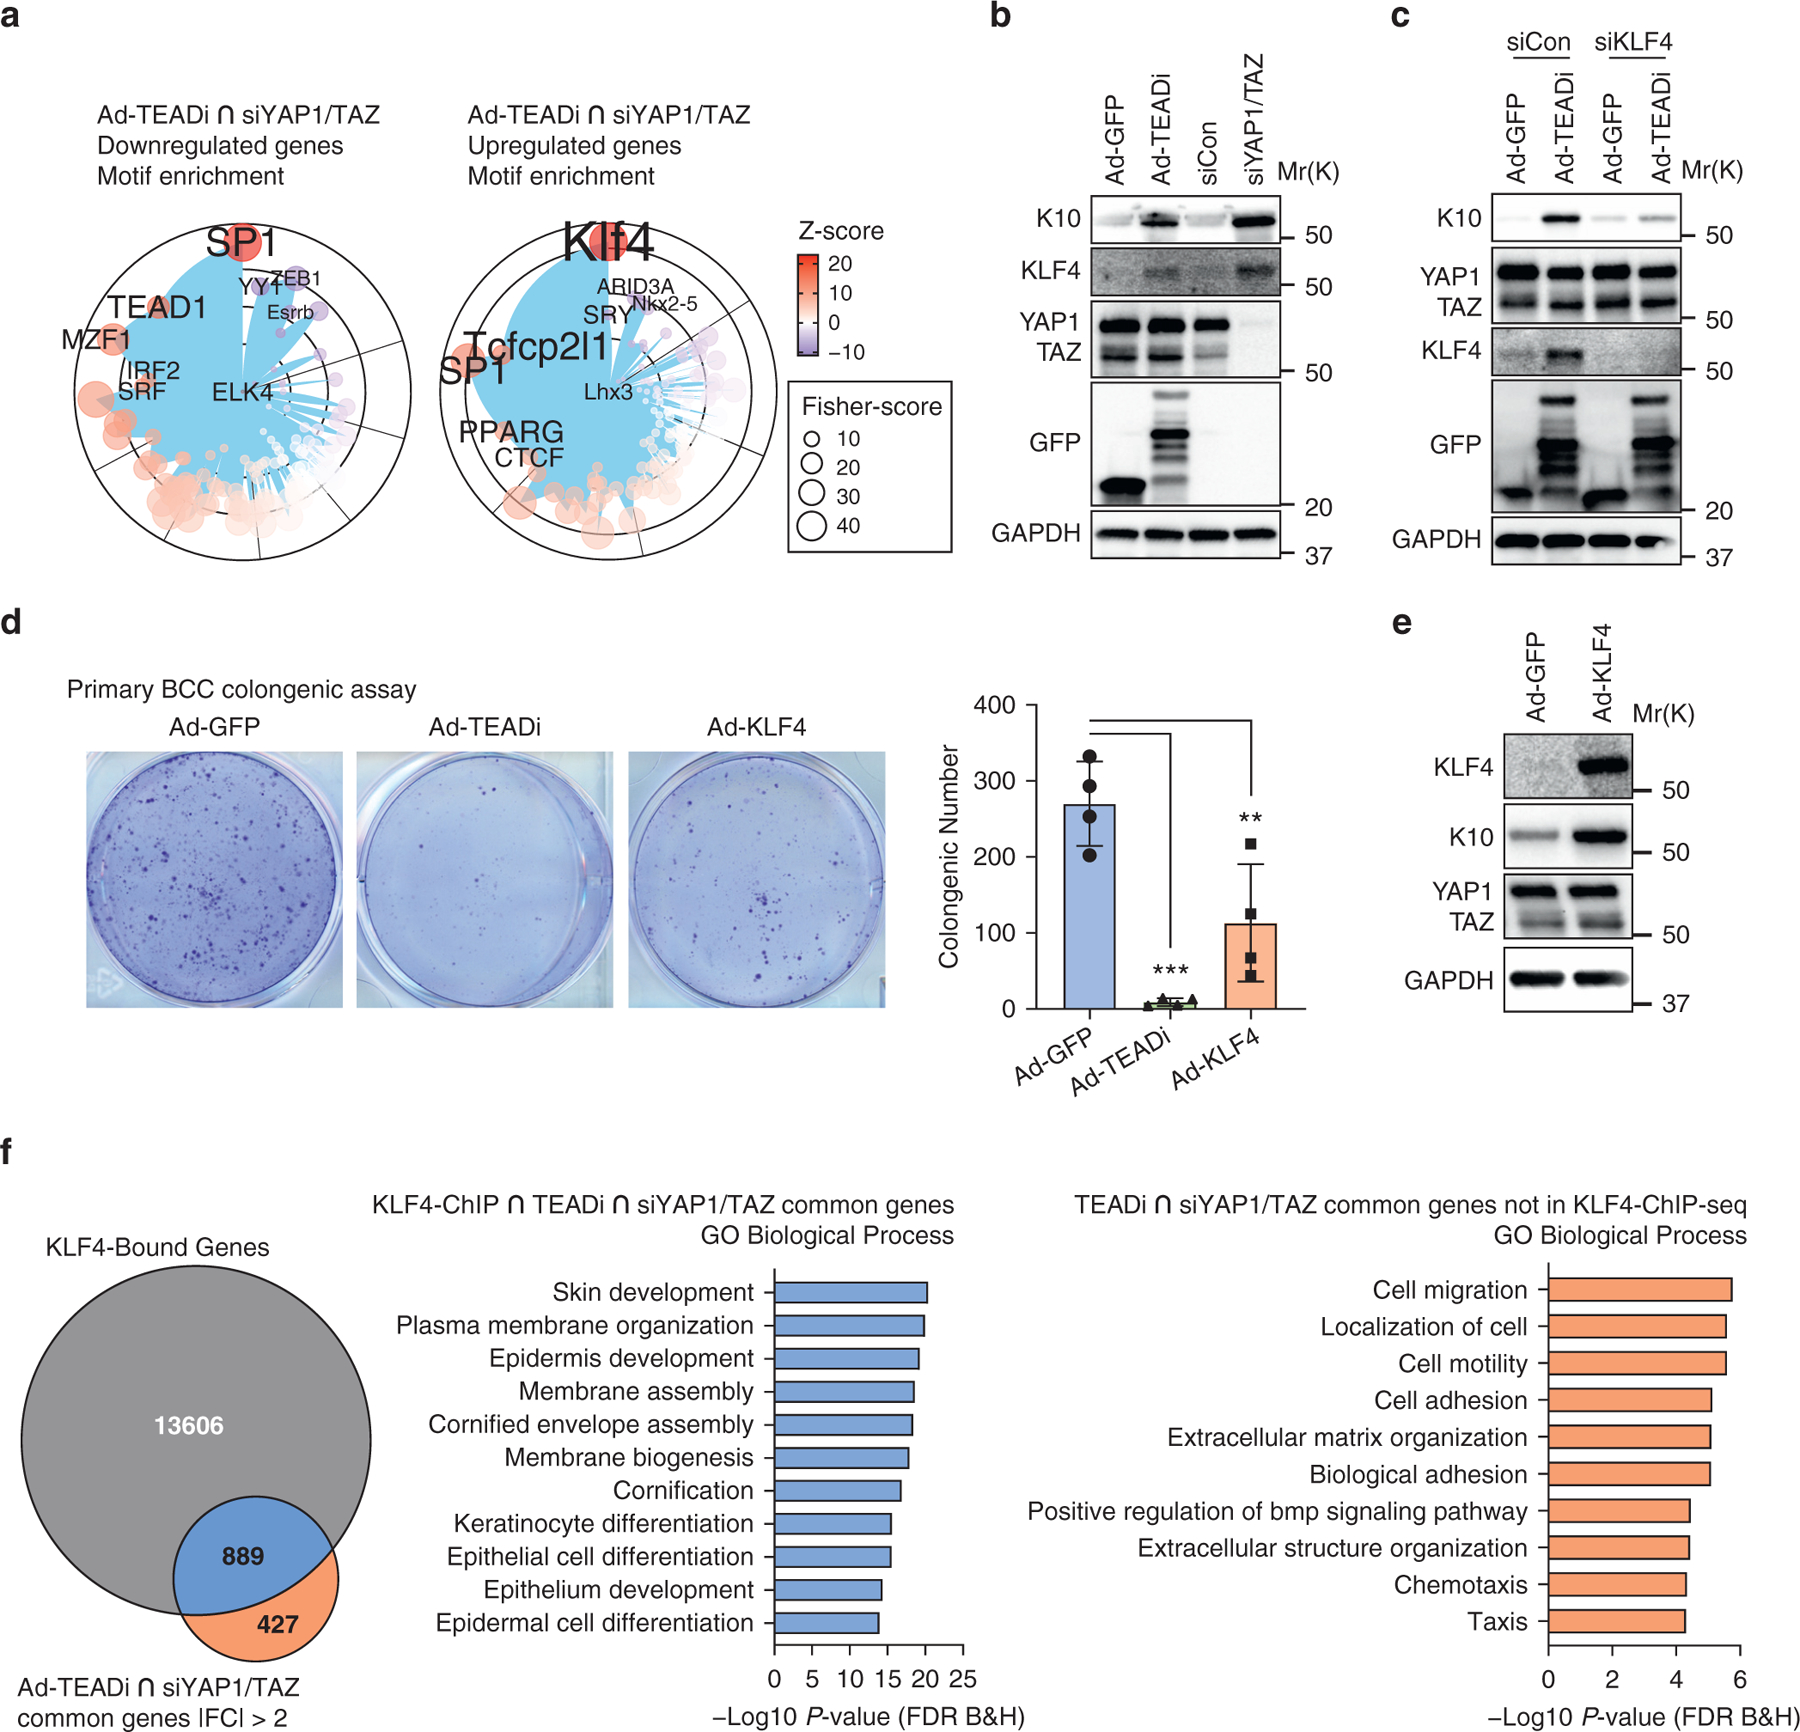
Figure 2. YAP1/TAZ and TEAD inhibition in BCC activate KLF4 transcription.

(a) Graph showing the transcription factor binding site enrichment analysis using genes differentially regulated by both siYAP1/TAZ and TEADi (indicated in yellow in Figure 1f); only the top enriched transcription factors are highlighted; color represents Z-score, and size represents Fisher score. (b) Western blot analysis of the indicated markers 48 hours after transduction of cultured BCC keratinocytes with Ad-TEADi (GFP) and control Ad-GFP or with pooled siYAP1/TAZ or control siCon. (c) Western blot analysis of the indicated markers in BCC cultured keratinocytes infected with Ad-TEADi (GFP) or control Ad-GFP, transduced 12 hours later with siRNAs targeting KLF4 or negative siCon and harvested after 48 hours. (d) Clonogenic assay of cultured BCC keratinocytes transduced with control Ad-GFP, Ad-TEADi, or Ad-KLF4. Representative picture and colony numbers from four replicates. Two-way ANOVA with Dunnett’s multiple comparisons test was used (**P < 0.01, ***P < 0.001). (e) Western blot of the indicated markers in BCC-cultured keratinocytes transduced with Ad-KLF4 or control Ad-GFP for 48 hours. (f) Venn diagram indicating the overlap between genes with KLF4 binding (KLF4 ChIP-seq) and genes commonly regulated by TEADi and siYAP1/TAZ and top GO biological process terms from genes in the overlap area (indicated in blue) or exclusively in the TEADi–siYAP1/TAZ dataset (indicated in orange). Ad-GFP, adenoviruses expressing a GFP; Ad-KLF4, adenoviruses expressing KLF4; Ad-TEADi, adenoviruses expressing a GFP-tagged TEAD inhibitor; BCC, basal cell carcinoma; ChIP, chromatin immunoprecipitation; ChIP-seq, chromatin immunoprecipitation sequencing; FC, fold change; FDR, false discovery rate; GO, gene ontology; K, keratin; siCon, small interfering RNAs targeting control; siKLF4, small interfering RNAs targeting KLF4; siRNA, small interfering RNA; siYAP1/TAZ, small interfering RNAs targeting YAP1 and TAZ; TEADi, TEAD inhibitor
