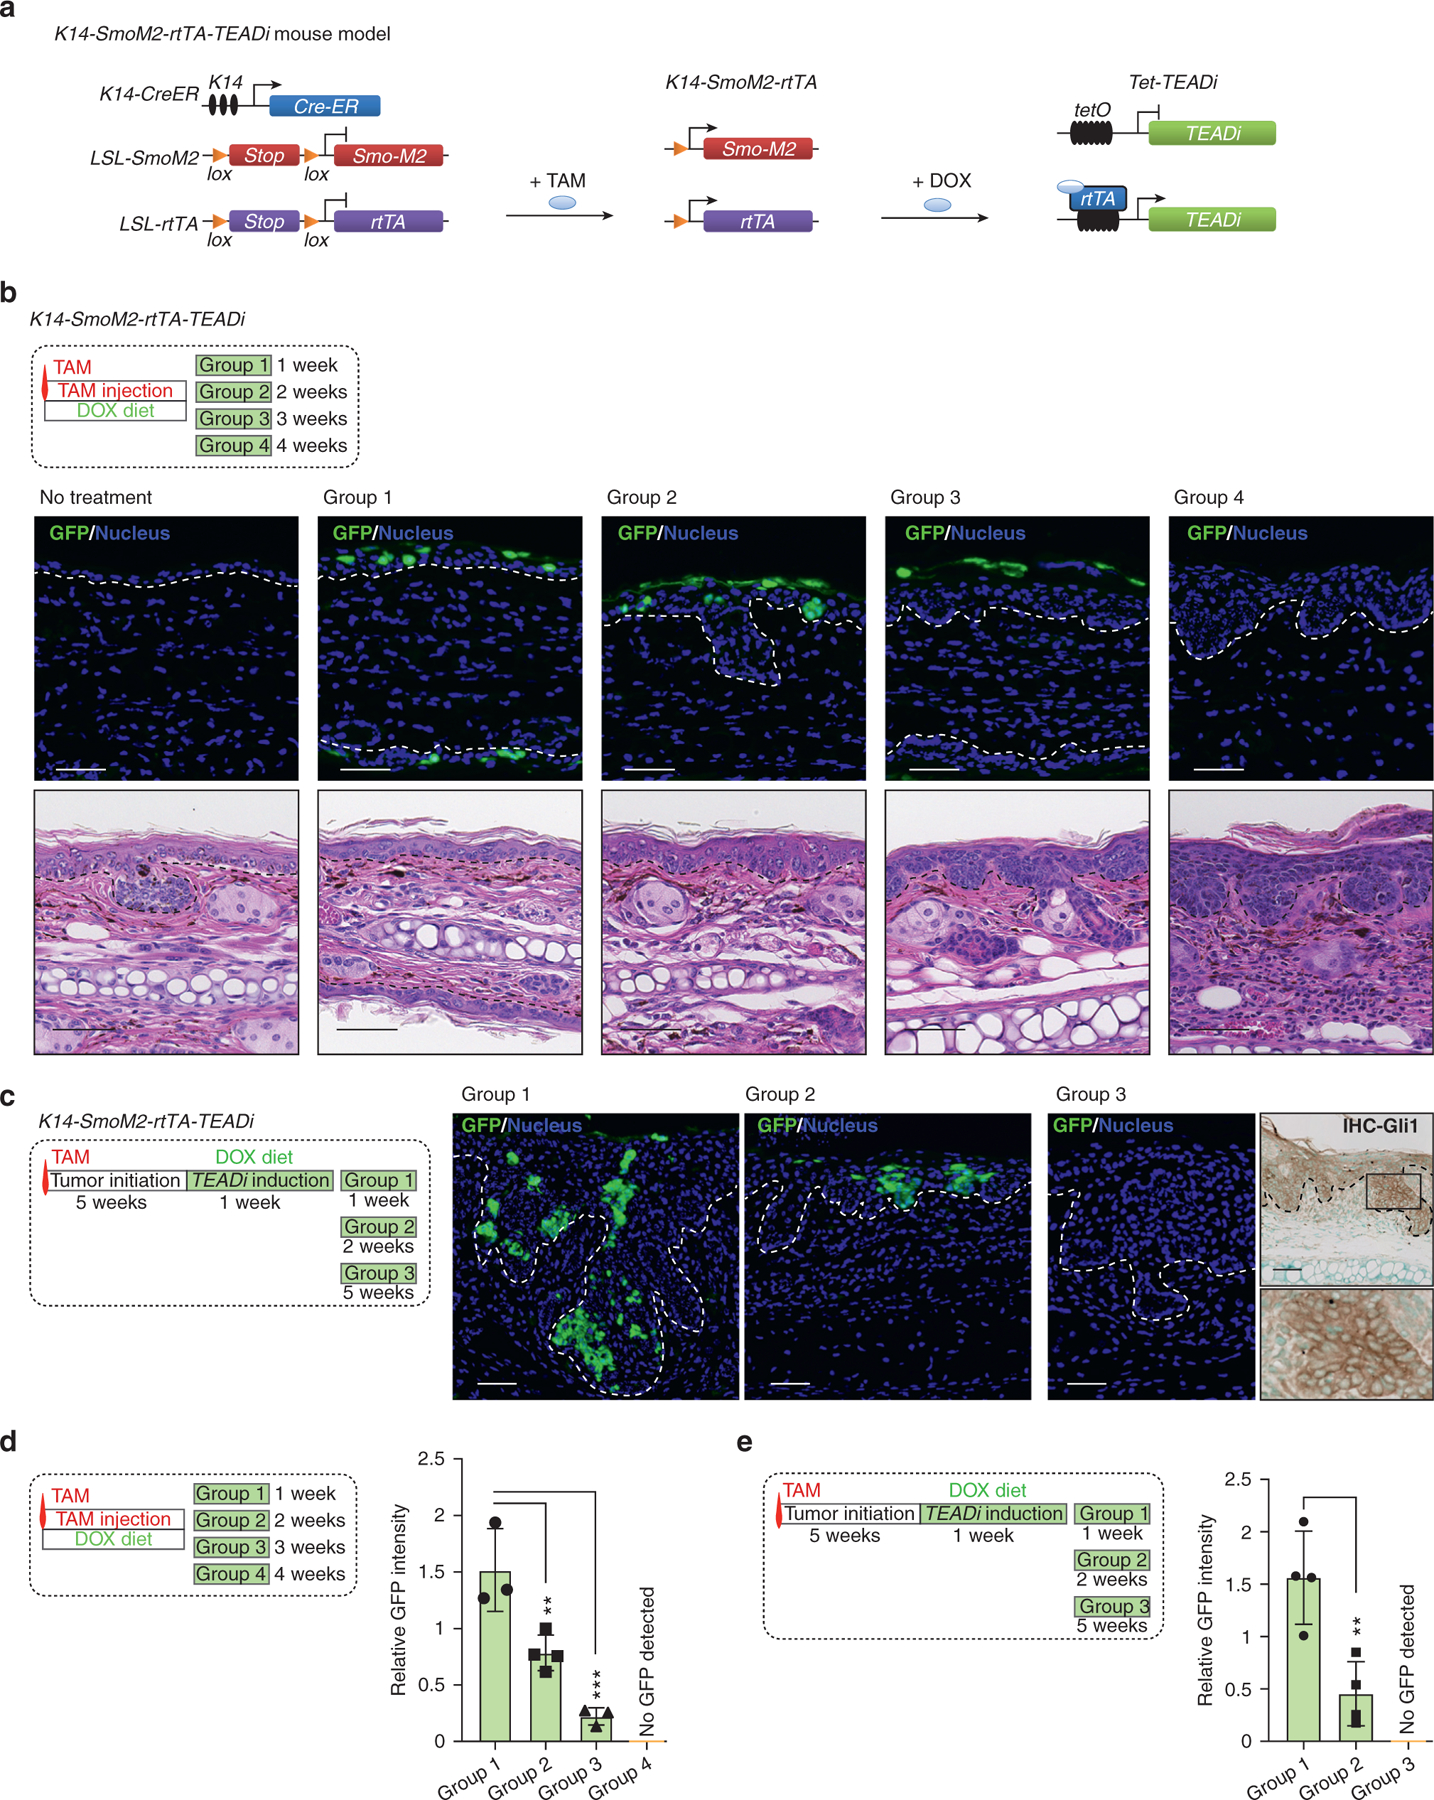
Figure 5. TEAD inhibition leads to the rapid elimination of tumor cells in BCC lesions.

(a) Schematic diagram presenting the mouse model used to trigger TEADi expression in BCC tumors. (b) Timeline and histological analysis of ear tissue from mice induced with one dose of TAM and concomitantly given DOX to activate TEADi expression; GFP staining shows TEADi-positive cells at the indicated time points (Bar = 20 μm); representative pictures from mice are analyzed (Bar = 50 μm); n = 3 for no treatment group and groups 1 and 3; n = 4 for groups 2 and 4. The basal layer of the epidermis is indicated with a dotted line. (c) Timeline and TEADi expression (GFP) in ear tissue from mice induced with one dose of TAM and given DOX 5 weeks later to activate TEADi expression after tumor formation; representative pictures are from n = 4 mice analyzed for groups 1−3 (Bar = 50 μm). The last right panel indicates IHC staining for GLI1 in group 3 ear section, and magnification of the area is indicated with a box. The basal layer of the epidermis is indicated with a dotted line. (d, e) Quantifications of GFP expression level from each time point as indicated in Figure 5b and c; one-way ANOVA with Dunnett’s multiple comparisons test (**P < 0.01, ***P < 0.001). BCC, basal cell carcinoma; DOX, doxycycline; IHC, immunohistochemistry; K14, keratin 14; TAM, tamoxifen; TEADi, TEAD inhibitor
