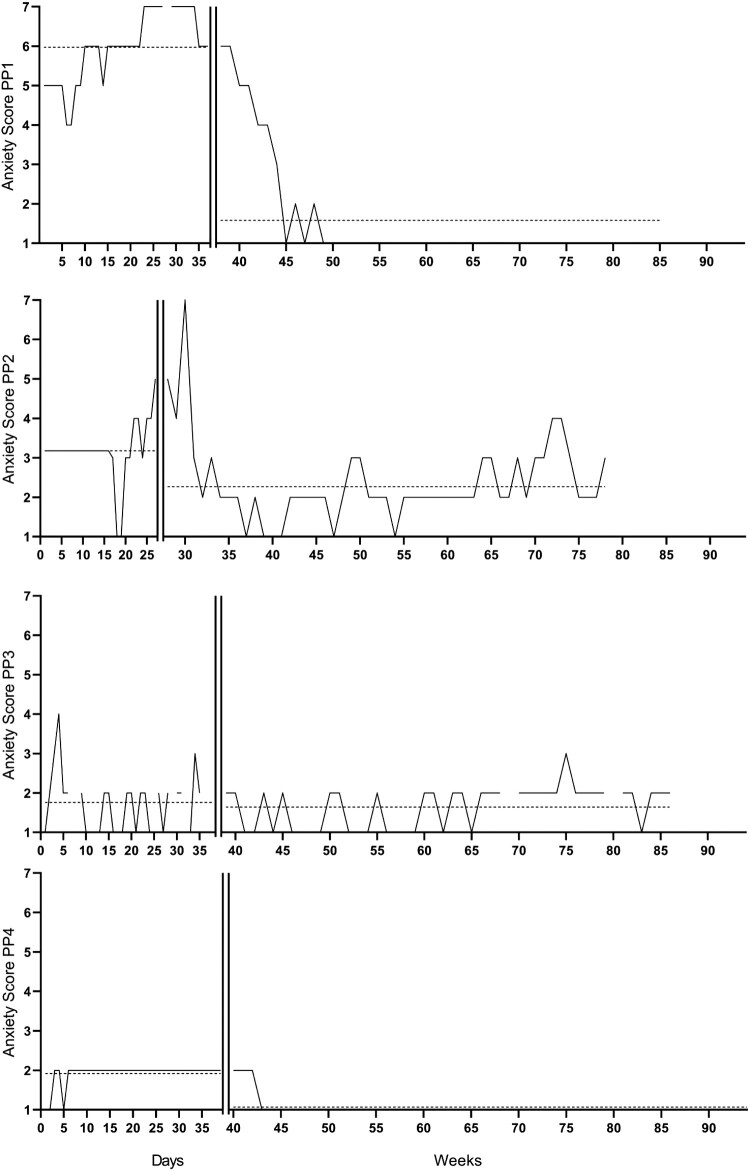
Figure 2.
Repeated measures of anxiety symptoms per participants 1, 2, 3, and 4 over time. The vertical line is the start of the intervention. The horizontal line is the average score per phase. The participants started with the baseline phase at different dates (participant one started on 6 August 2018, participants two on 9 August 2018, participant 3 on 31 October 2018, and participant 4 on 22 January 2019).

