Figure 4.
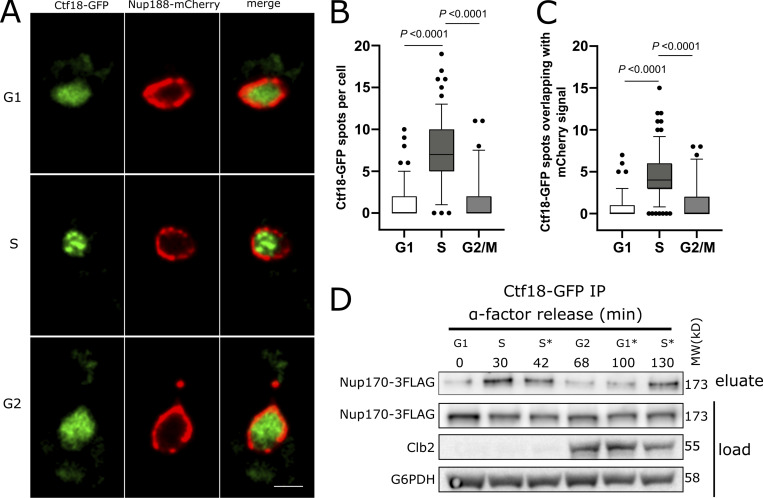
Ctf18 interaction with the NPC is peaks during S phase. (A) Cells expressing genomically encoded Nup188-mCherry and Ctf18-GFP were arrested in G1 phase by α-factor and images were acquired at regular intervals for 110 min after release from arrest. Representative images are shown for different cell cycle stages. Scale bar = 2 µm. (B) Box plot showing the number of Ctf18-GFP spots per cell at the G1 (n = 140), S (n = 155), and G2/M (n = 69) cell cycle stages. (C) Box plots showing the number of Ctf18-GFP spots overlapping with NPCs at those stages. In B and C, the P values are from Wilcoxon rank sum tests. The bars represent the 5th and 95th percentiles, and the dots are outliers. (D) Cells producing Ctf18-GFP and Nup170-3FLAG were arrested in G1 and samples were collected at indicated time points after release. The Ctf18-GFP fusion protein was affinity-purified from cell lysates and the eluate was analyzed by immunoblotting to detect Nup170-3FLAG. The cell cycle stages are indicated based on G1 arrest and Clb2 (indicative of G2 stage) levels in cell lysates. Cell cycle stages with an asterisk (*) are based on time after release from G1 arrest or after G2 stage. Anti-FLAG, Clb2, and G6PHD antibodies were used for immunoblotting. MW, molecular weight. Source data are available for this figure: SourceData F4.

