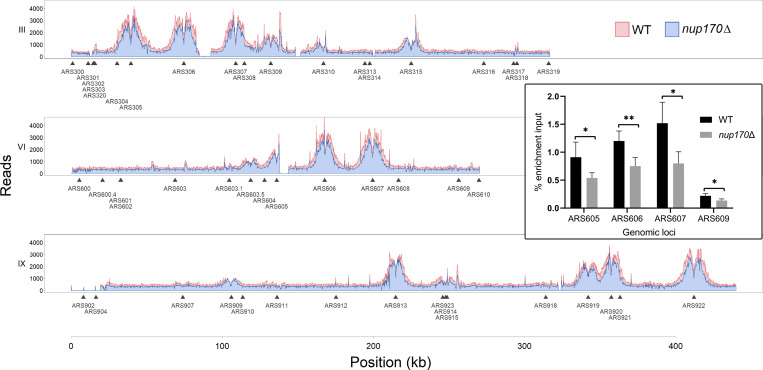
Figure 6.
PCNA levels on chromatin decline in nup170Δ cells. Cells were synchronized in G1 and released into HU-containing YPD medium to arrest them in S phase, and ChIP was performed using an anti-PCNA antibody. Normalized PCNA binding profiles along chromosomes III, VI, and IX obtained by ChIP-seq analysis visualized with the Integrative Genomics Viewer. For visualization, sequencing reads from nup170Δ cells were downsampled by 22% and plotted to reflect the relative recovery of chromatin compared with WT cells. Inset shows PCNA enrichment at the indicated autonomously replicating sequence (ARS) sites analyzed by qPCR. Means ± SD from four experiments are shown; *P < 0.05, **P < 0.01. The P is from a two-tailed Student’s t test.

