Figure S2.
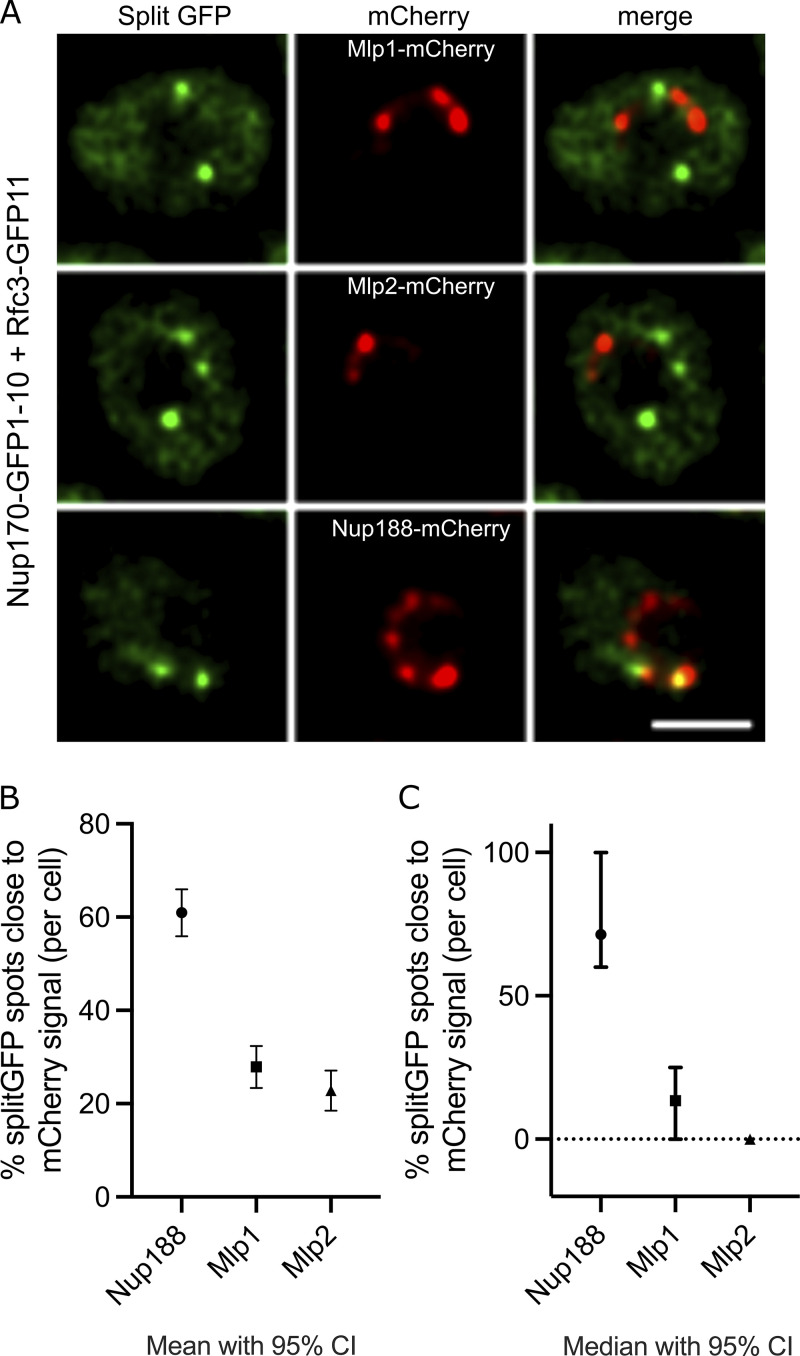
Ctf18-RFC interacting NPCs lack Mlp1 and Mlp2. (A) Images of cells co-expressing Nup170–GFP1-10 and Rfc3-GFP11 in strains where Mlp1, Mlp2, or Nup188 are endogenously tagged with mCherry. Scale bar = 2 µm. (B) Mean of percentages of splitGFP foci overlapping with mCherry signal. (C) Median of percentages of splitGFP foci overlapping with mCherry signal. In B and C, the error bars represent 95% confidence intervals. Number of cells analyzed: Mlp1, 237; Mlp2, 273; and Nup188, 265.

