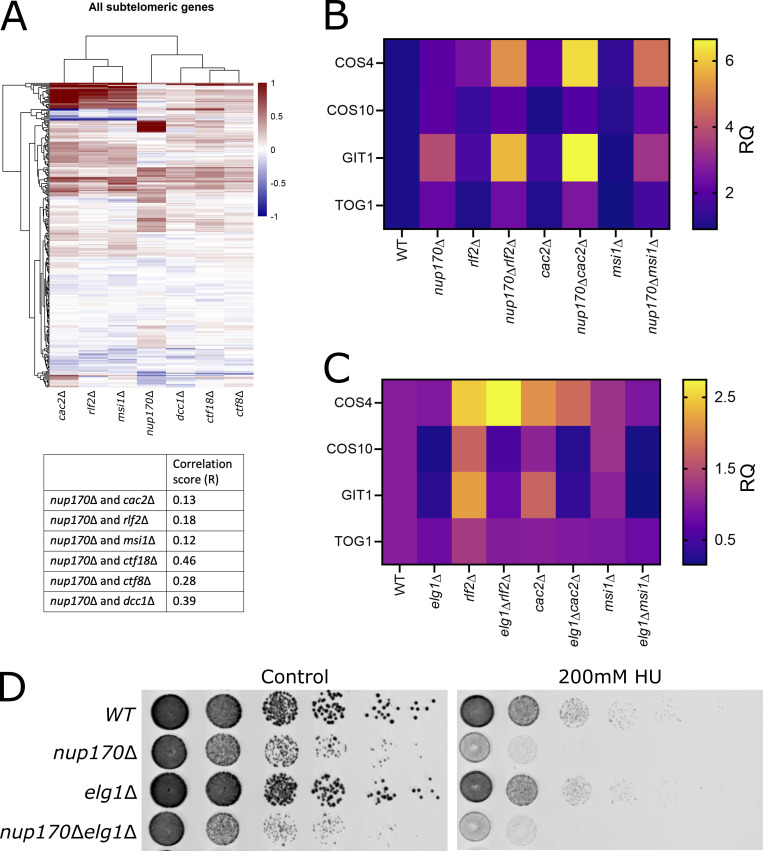
Figure S5.
Functional relationship between Nup170, Ctf18-RFC complex, CAF-1 complex, and Elg1. (A) Heatmap showing similarities in subtelomeric genes expression profiles between nup170Δ and mutants lacking components of CAF-1 and Ctf18-RFC complex. Correlation scores (R) are listed below the heatmap. (B and C) Gene expression levels of four subtelomeric genes were measured by RT-qPCR in strains lacking components of CAF-1 complex individually or when combined either with nup170Δ (in A) or elg1Δ (in B). RQ values from three biological replicates are presented as heatmaps. (D) Log-phase cultures of the indicated strains were equalized in cellular density, serially diluted 10-fold, and spotted onto plates containing YPD with or without 100 mM HU. Plates were scanned after 2 d at 30°C.

