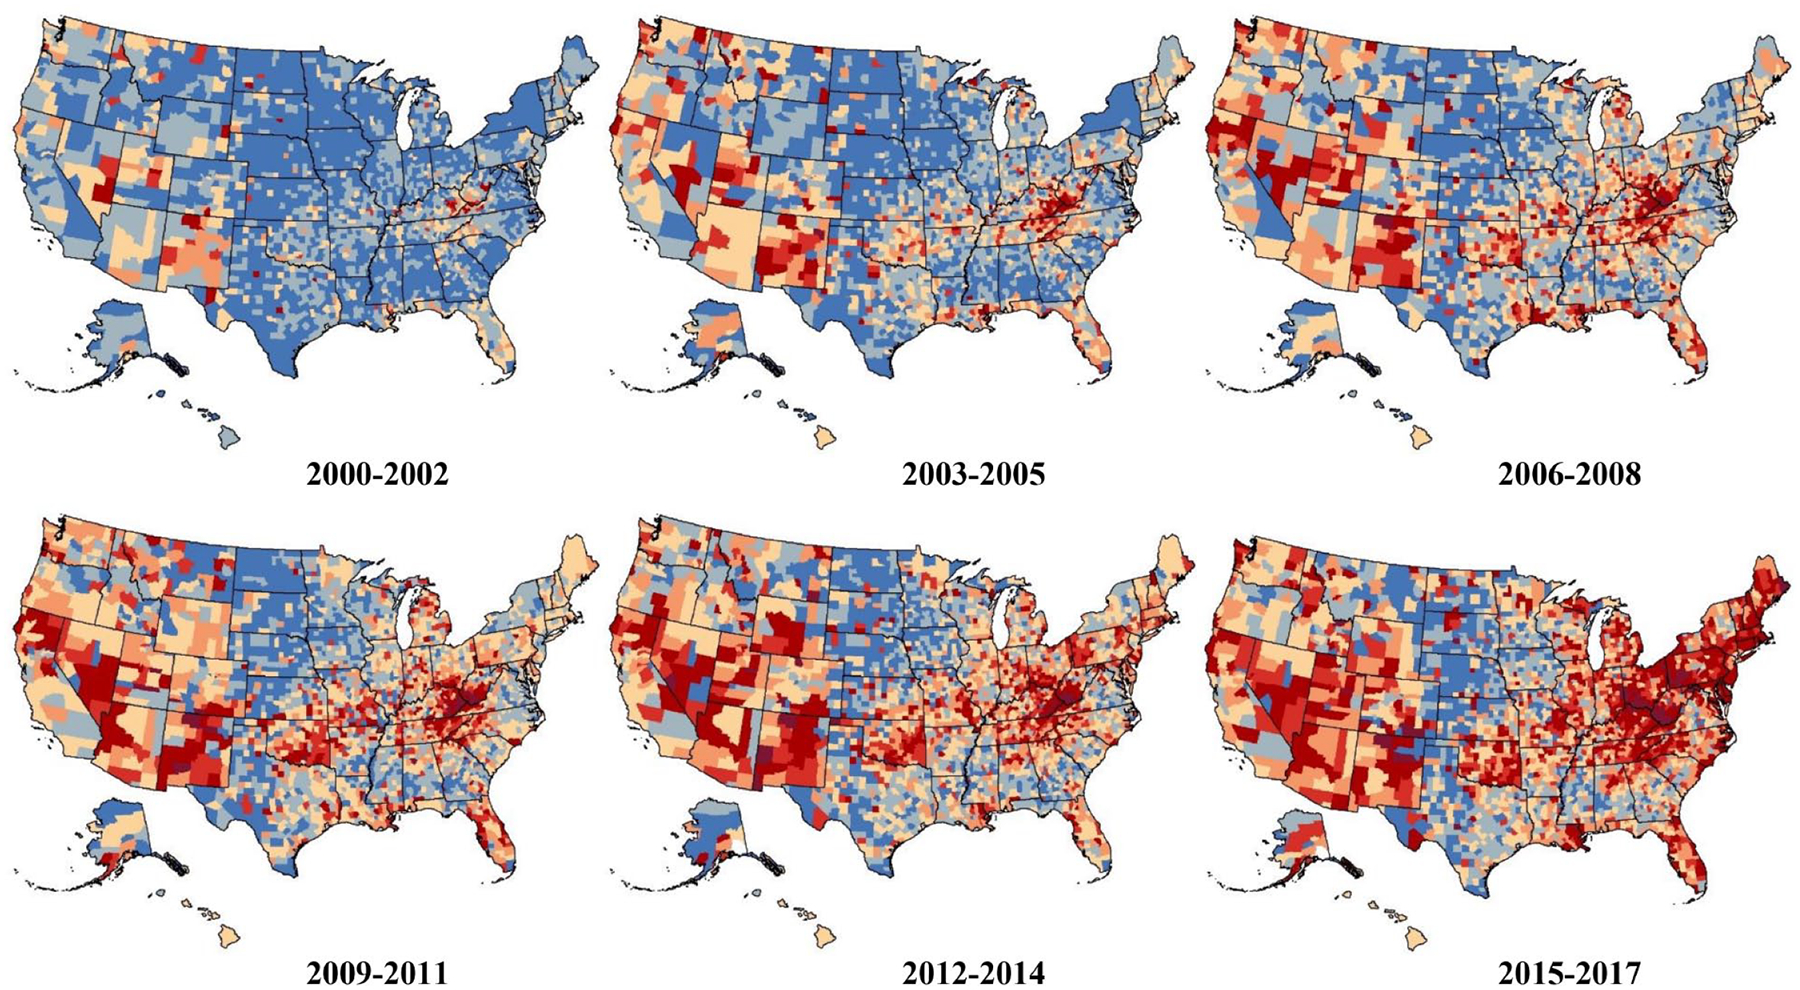
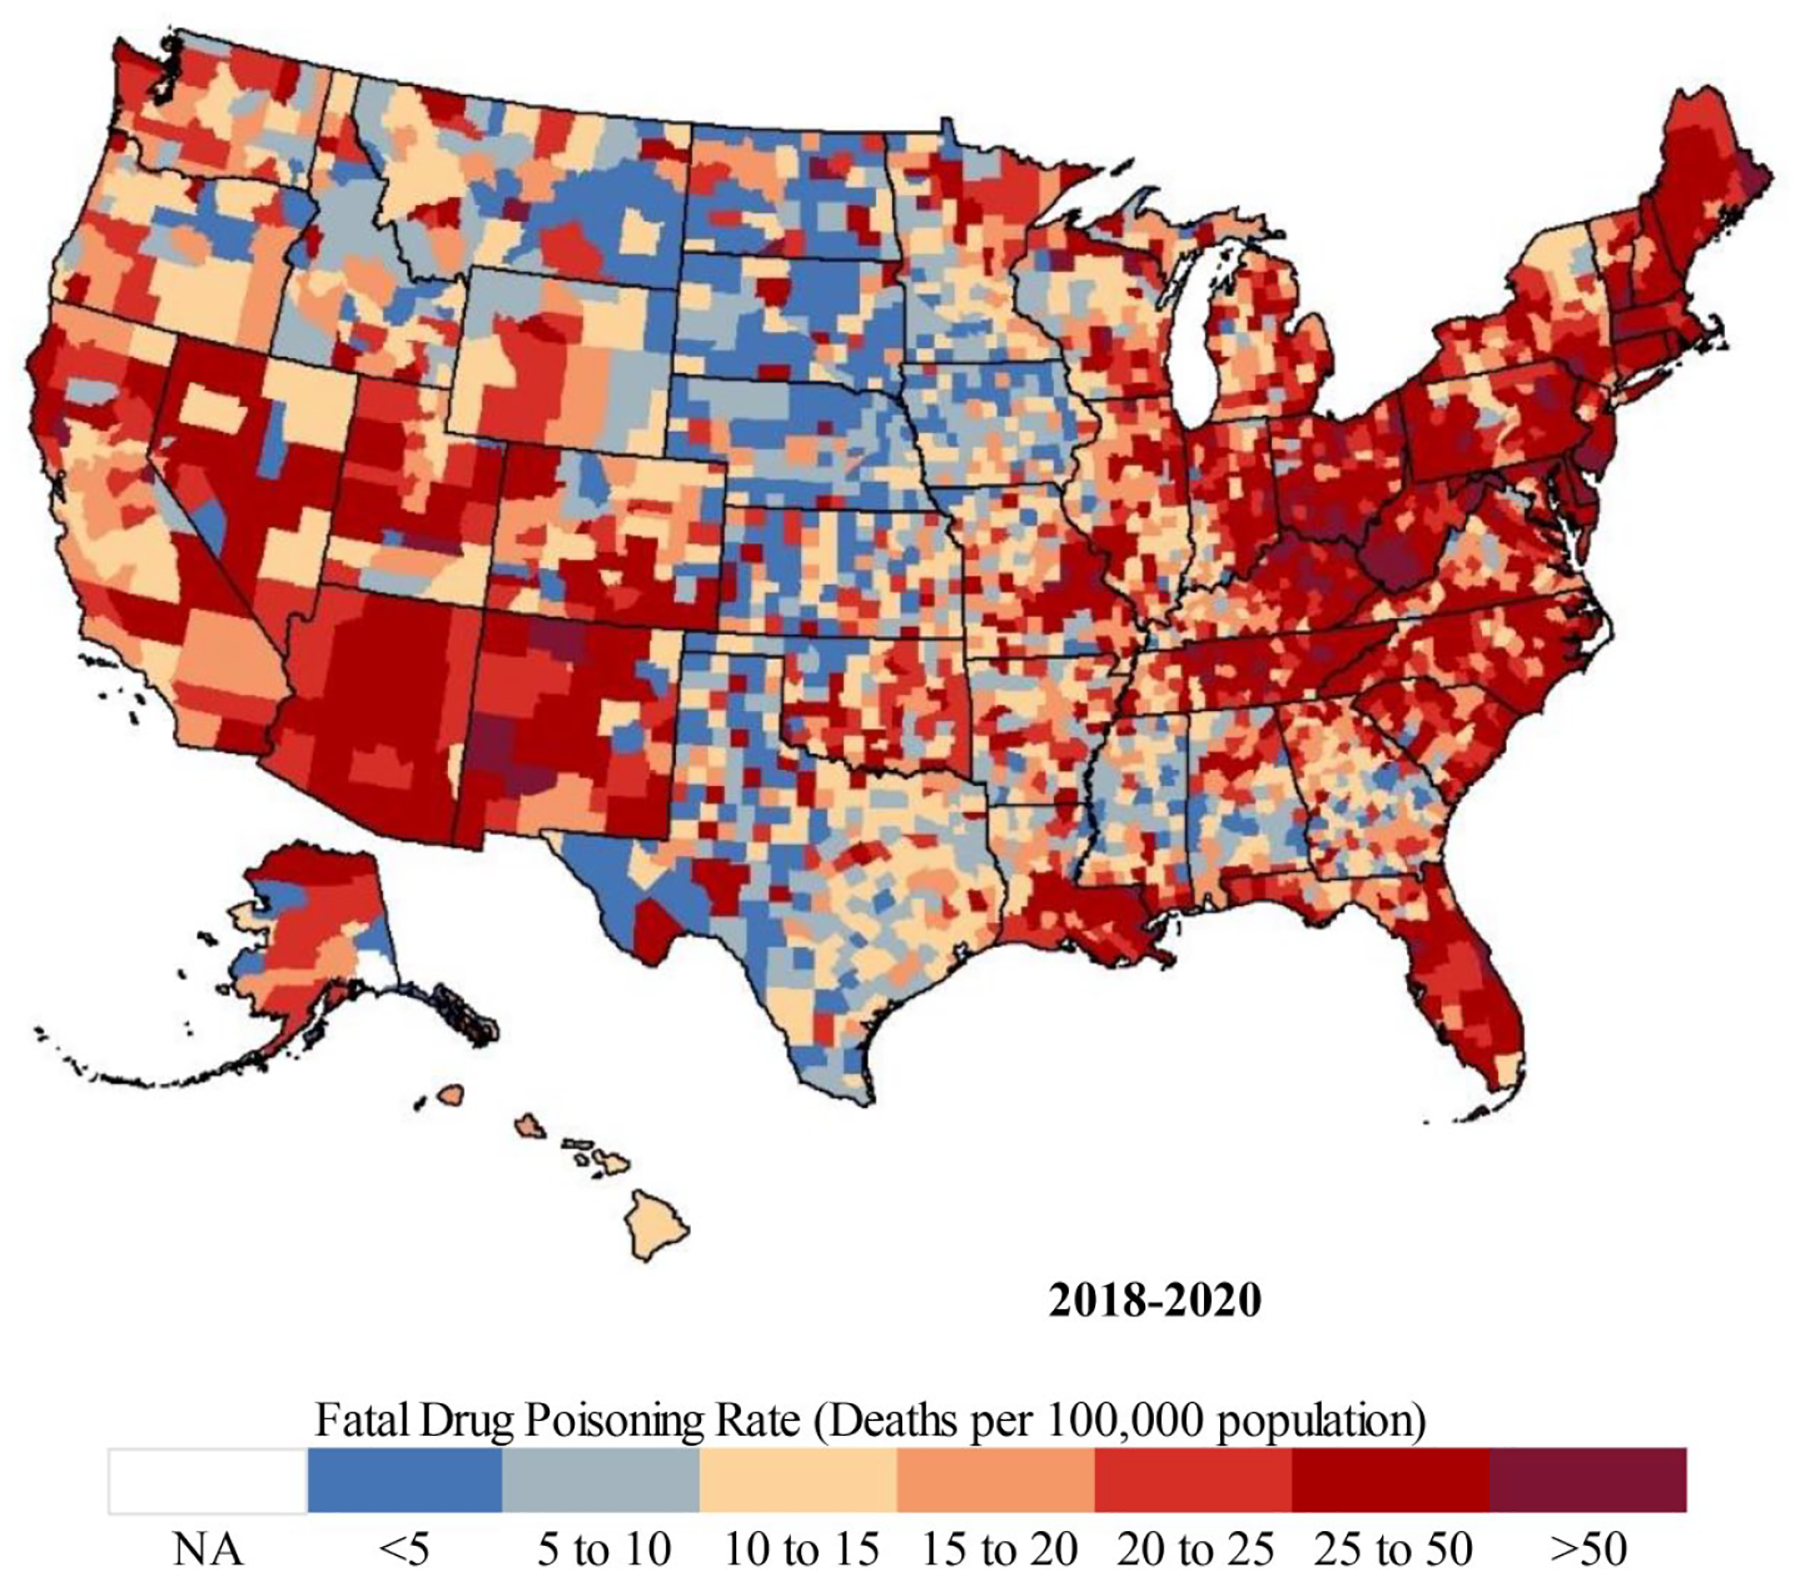
FIGURE 4.


Fatal Drug Poisoning Rates by County, 2000–2020
SOURCE: NCHS, National Vital Statistics System restricted use death certificate files, 2000–2020.
NOTE: Rates are age adjusted. Deaths are pooled across three years to avoid large fluctuations that can occur in counties with small populations and low death counts. NA = data not available.
