Fig. 1.

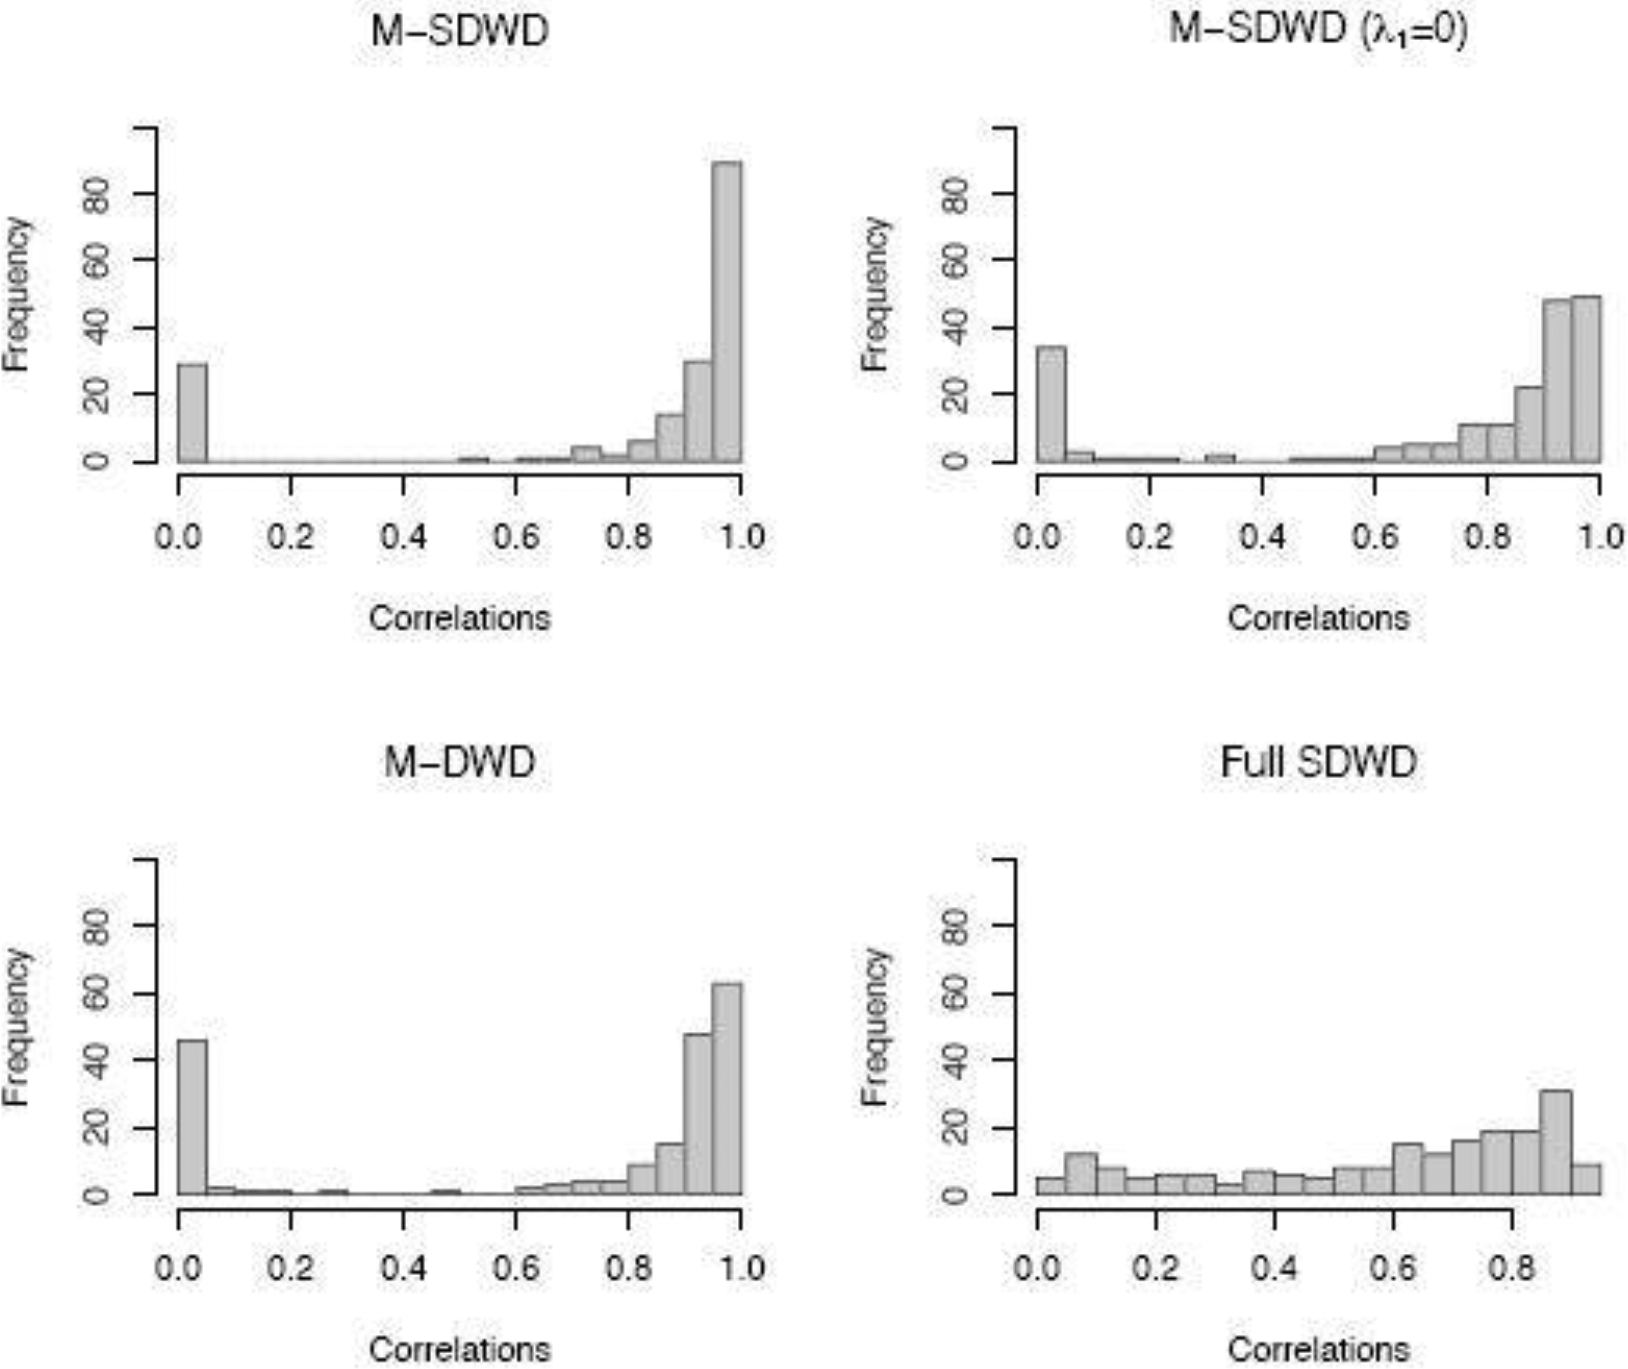
Histogram of correlations between true hyperplane and estimates with four classification methods under the more sparsity case based on high dimensional data (30 × 15 × 15) and sample size N = 100.

Histogram of correlations between true hyperplane and estimates with four classification methods under the more sparsity case based on high dimensional data (30 × 15 × 15) and sample size N = 100.