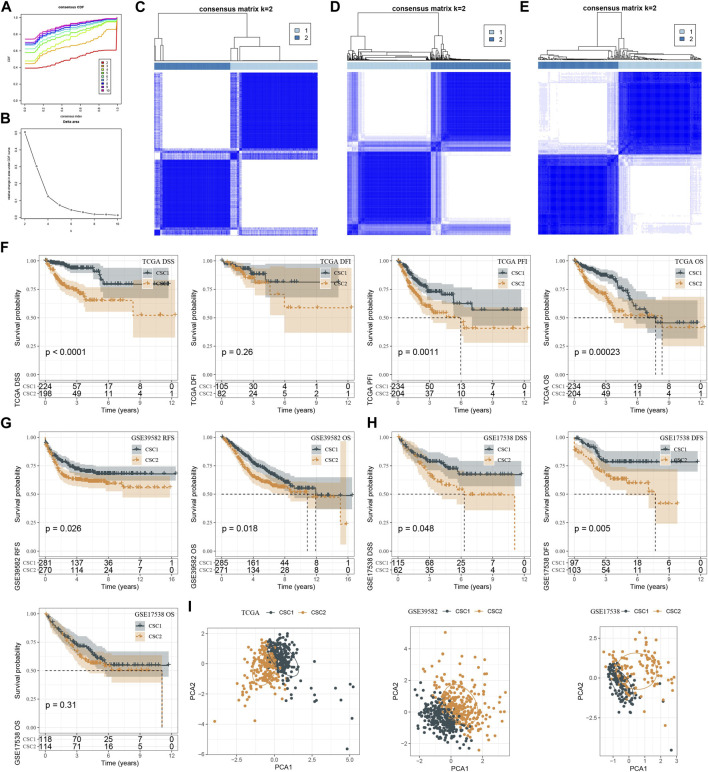
FIGURE 3.
Molecular subtyping based on CSC markers. (A, B) CDF curves and relative change under CDF curves when cluster number k was 2–10 in TCGA dataset. (C–E) Consensus matrix when k = 2 in TCGA (C), GSE39582 (D) and GSE17538 (E) datasets. (F–H) Kaplan-Meier survival curves of CSC1 and CSC2 for different survival time in TCGA (F) GSE39582 (G) and GSE17538 (H) datasets. (I) PCA plots of CSC1 and CSC2 in three datasets. OS, overall survival; DSS, disease-specific survival; DFI, disease-free interval; PFI, progression-free interval; RFS, recurrence-free survival; DFS, disease-free survival.

