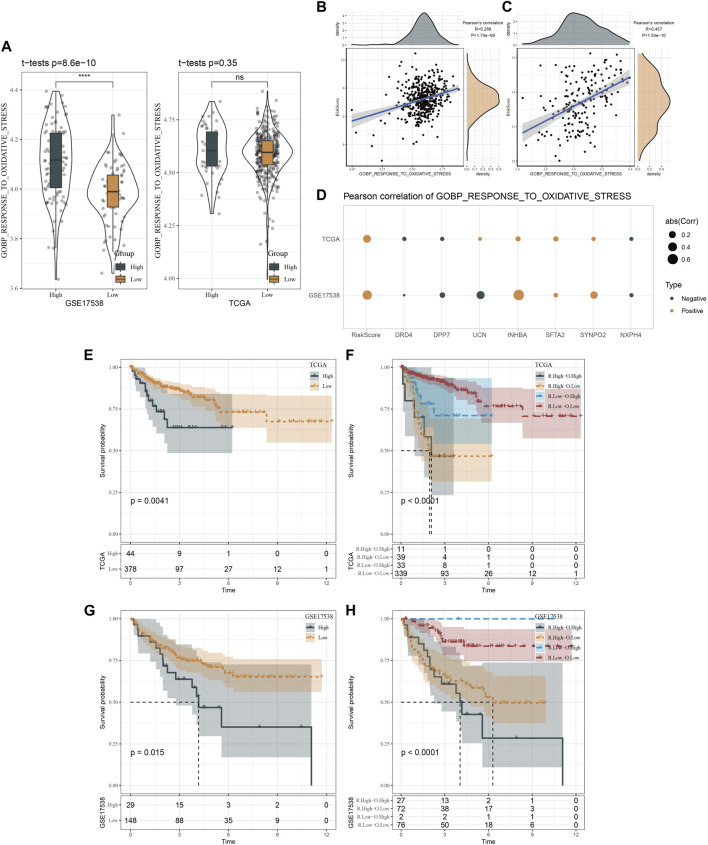
FIGURE 9.
Oxidative stress analysis of two risk groups. (A), Distribution of GOBP gene set in TCGA and GSE17538 datasets. (B, C), Pearson correlation analysis of risk score with the response to oxidative stress in TCGA and GSE17538 datasets. (D), Pearson correlation analysis of risk score and risk genes with the response to oxidative stress in TCGA and GSE17538 datasets. (E, F), Kaplan-Meier survival curves of two risk groups or combination of risk score and oxidative stress in TCGA. (G, H), Kaplan-Meier survival curves of two risk groups or combination of risk score and oxidative stress in GSE17538.

