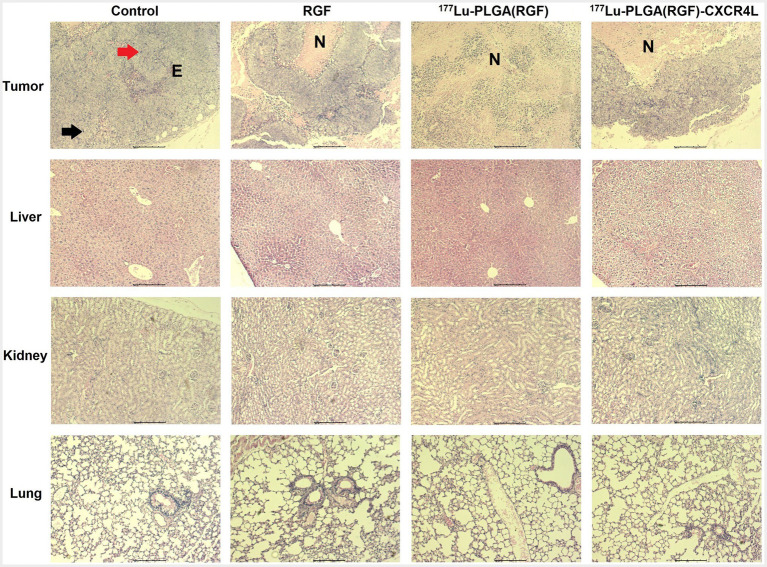
Figure 14.
Microscopic overview of tumor, liver, kidney, and lung histopathology after 14 days of treatment of RGF, 177Lu-PLGA(RGF) and 177Lu-PLGA(RGF)-CXCR4L. The control is from untreated mice. Mitotic forms (red arrow); atypical nuclei (black arrow). Epithelial cells (E). Necrosis (N). The scale bar represents 200 μM.

