Figure 6.
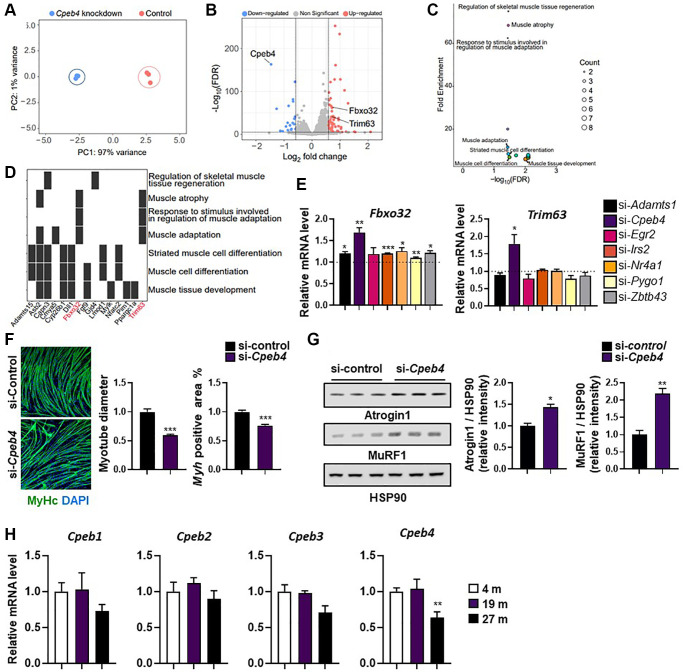
Knockdown of Cpeb4 induces atrophy in C2C12 myotubes. (A) Principal component analysis (PCA) of RNA-seq datasets from C2C12 myotubes for control and Cpeb4-knockdown cells. (B) Volcano plot of differential expression analysis. (C) Summarized gene ontology terms related to biological processes. (D) Functional annotation clustering using Database for Annotation, Visualization, and Integrated Discovery. (E) mRNA expression of genes related to muscle wasting (Fbxo32, Trim63), measured by qPCR. (F) Representative image of myosin-stained Cpeb4 knockdown (si-Cpeb4) or control siRNA-treated (si-control) myotubes differentiated for 5 days. Quantification of myotube diameter and myosin-positive (Myh+) area. (G) Western blot showing expression of atrophy-related protein levels (Atrogin-1 (Fbxo32) and MuRF-1 (Trim63)) and quantification of target protein expression relative to HSP90 using densitometry analysis (n = 3). (H) Relative mRNA level of different Cpeb isoforms (Cpeb1–4) in the tibialis anterior muscle in young (4-month-old) and aged mice (19- and 27-month-old; (n = 4, 5). All data are represented as mean ± SEM. Statistically significant differences are denoted as *p < 0.05, **p < 0.01, ***p < 0.005.

