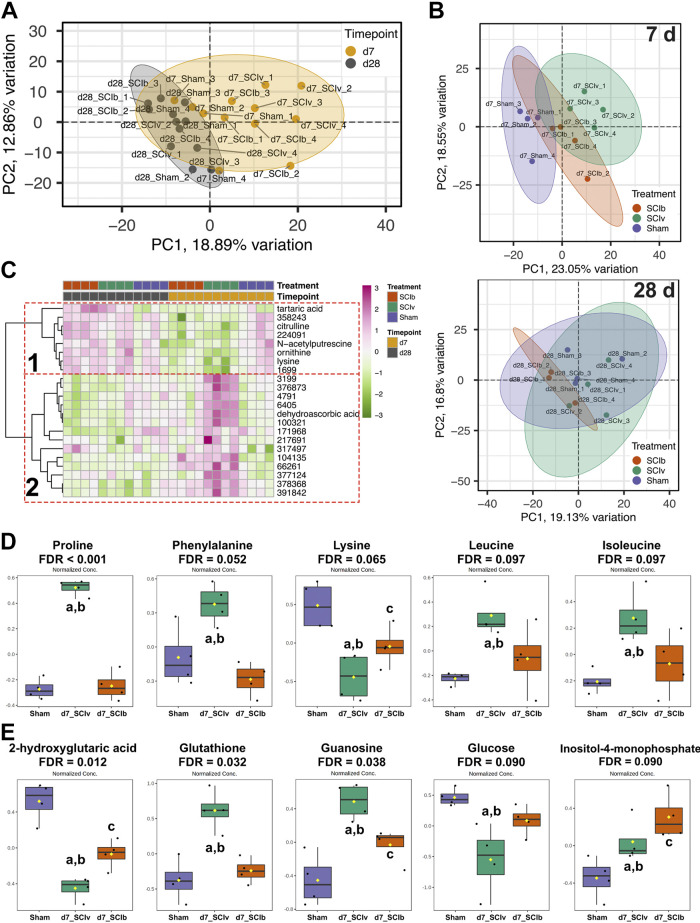
Figure 3.
Metabolomics profiles of the gastrocnemius 7 and 28 days post-SCI. A: PCA demonstrating timepoint-based clustering of all samples. B: top panel shows unique clustering of groups at 7 days, with the bottom panel showing more overlap. C: fixed-sample clustering heatmap of features with FDR < 0.10 using a mixed-model ANOVA shows a cluster of metabolites with reduced abundance in SCI mice at 7 days (dotted red box 1) and a cluster with boldine-elevated metabolites at 7 days (dotted red box 2). Boldine-associated changes in annotated metabolites 7 days after complete spinal cord transection for key amino acids (D) and other key molecules (E) associated with muscle health. Individual data points are presented in box and whisker plots with 95% confidence interval. The solid black line represents the median value and the edges of the box represent quartiles. Tukey’s multiple comparison test was used for follow-up analyses with adenoting statistical differences vs. Sham, bvs. SCIb and cvs. SCIv. FDR, false discovery rate; SCI, spinal cord injury.

