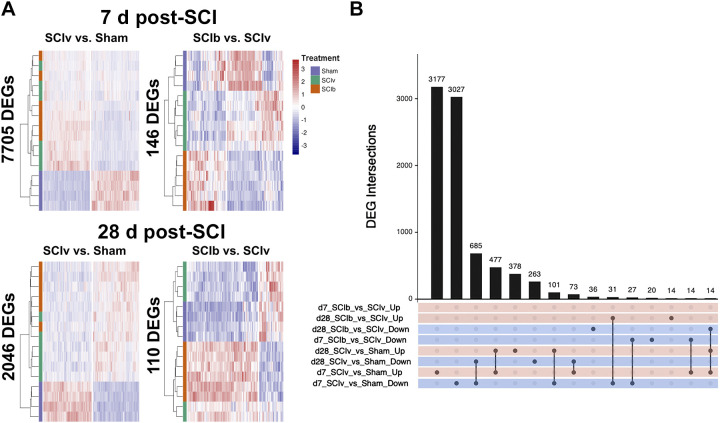
Figure 4.
Transcriptomic signatures of complete SCI at acute and subacute timeframes after injury. A: hierarchical clustering heatmaps across the main comparisons and timepoints. B: UpSetR plot showing the top 15 unique and overlapping DEG sets across all comparisons. DEG, differentially expressed gene; SCI, spinal cord injury.

