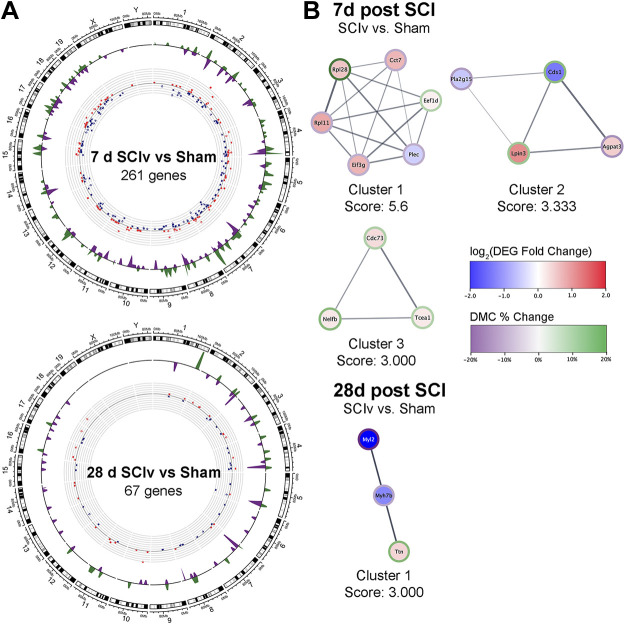
Figure 8.
DEG/DMC overlaps. A: Circos plots demonstrating the overlap and magnitude of change in DEGs and DMCs across the “SCIv and Sham” comparisons at 7 days and 28 days post-SCI. Red dots = upregulated genes, blue dots = downregulated genes; green waves = hypermethylated DMCs, purple waves = hypomethylated DMCs. B: all identified MCODE clusters from STRING association networks using genes with associated methylation changes for “SCIv vs. Sham” analyses at 7 days and 28 days post-SCI. DEG, differentially expressed gene; DMCs, differentially methylated CpG sites; SCI, spinal cord injury.

