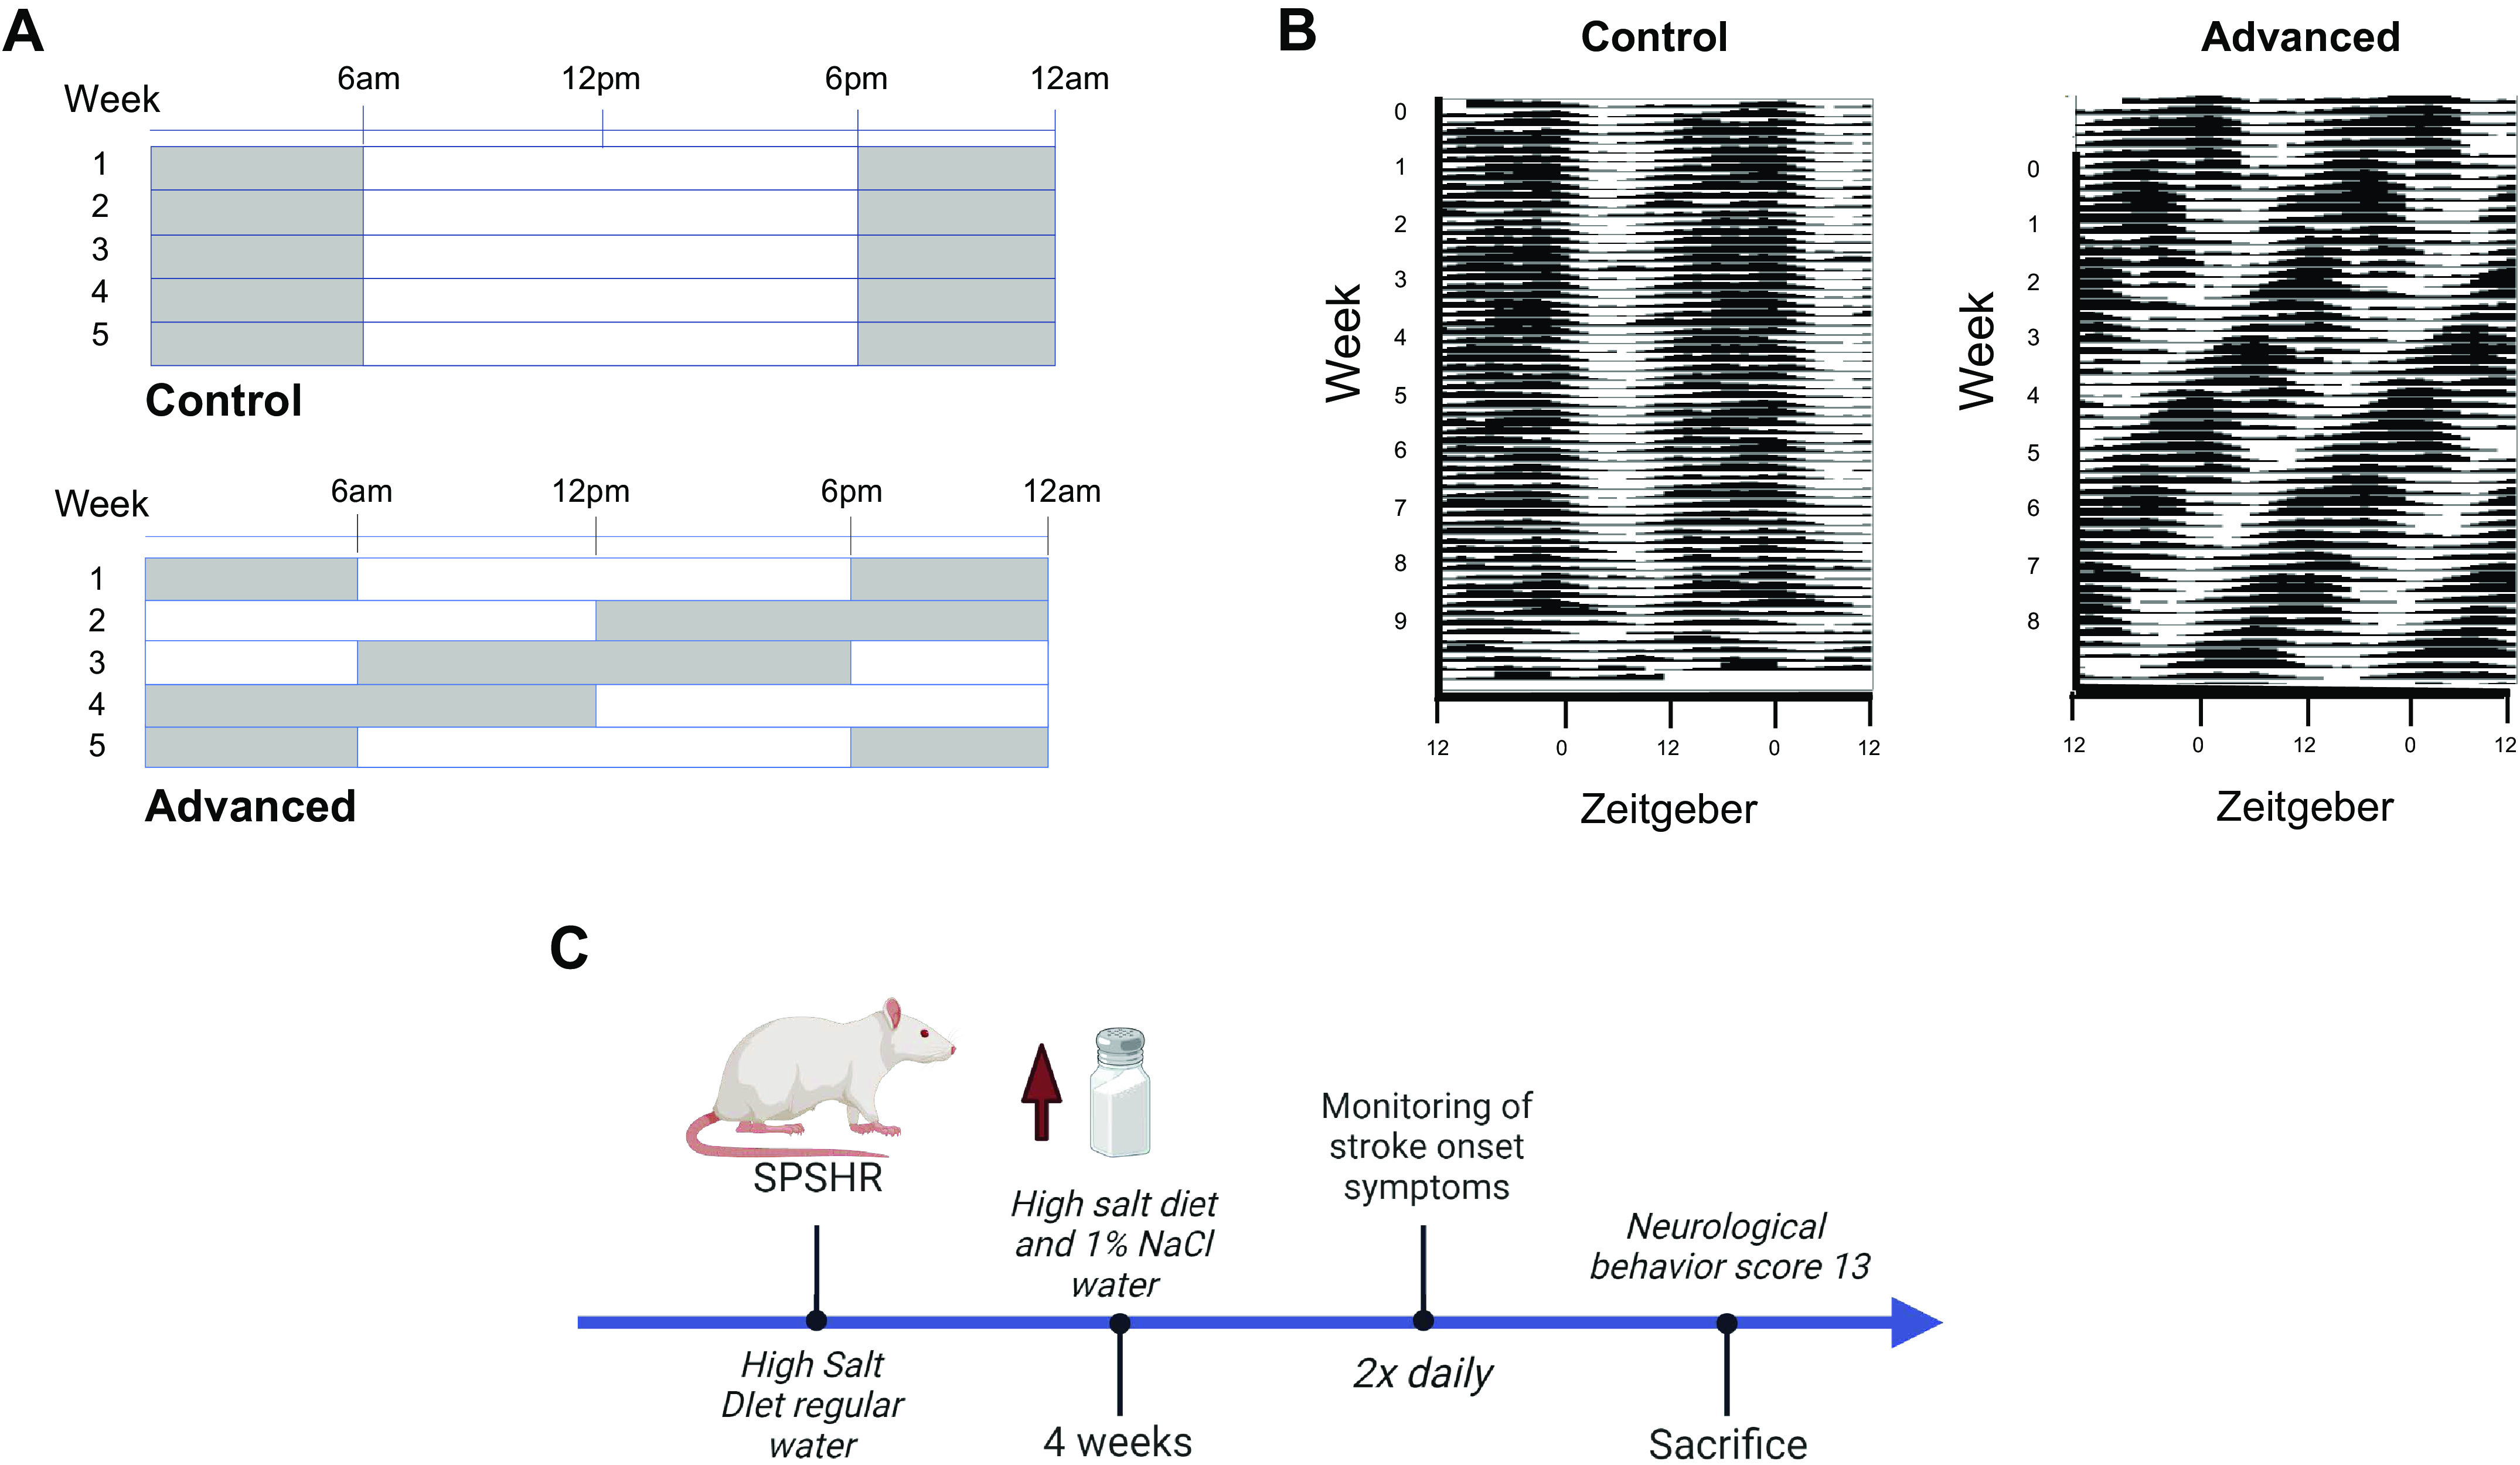
Figure 1.

Light and time-restricted diet schedules. A: schematics of the lighting schedules for each week of the study. B: representative actograms illustrating rat locomotor activity in either control (static) or phase-shifted light cycles. C: summary of the experimental protocol. SP-SHR, stroke-prone spontaneously hypertensive rat. Images created with a licensed version of BioRender.
