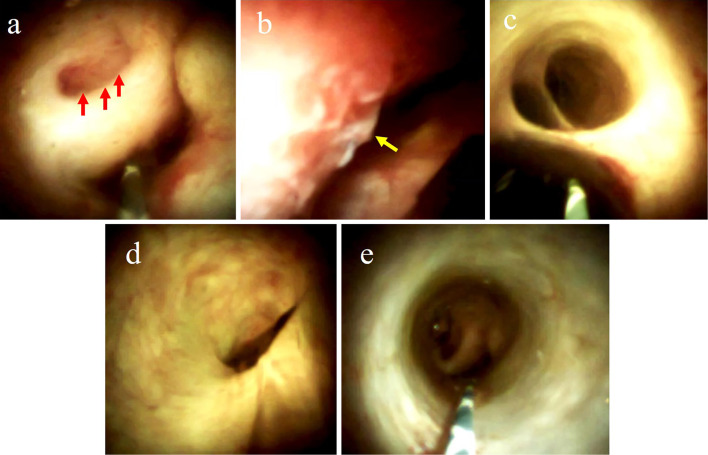
Figure 5.
Images visualized by POCS. (a) A granular nodular tumor in the cystic duct (red arrow). (b) The common hepatic duct compressed by the tumor; the irregular mucosal surface of the right side of common hepatic duct (yellow arrow). (c) A smooth surface was seen at the confluence of the hepatic ducts. The right hepatic duct can be seen in the upper part of the image. (d) A smooth surface was seen at the left hepatic duct. (e) A smooth surface was seen at the common bile duct.

