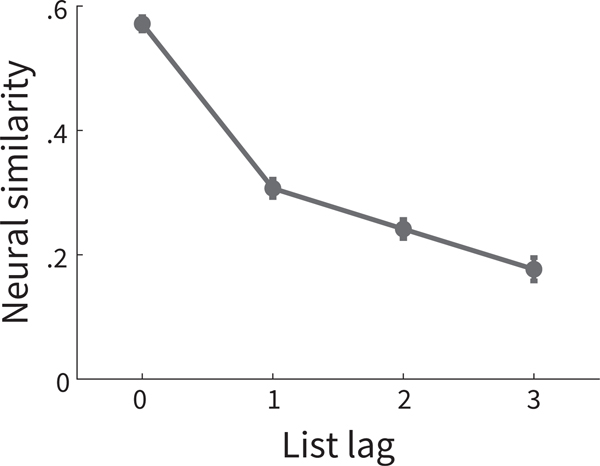
Figure B1. Neural similarity of feature vectors for item pairs from adjacent serial position numbers and the same task in control lists, as a function of list-lags.
Data are averaged across all possible values of i and i +1 (1 and 2, 2 and 3, ..., 15 and 16) for item pairs in control lists studied with the same task (size task, animacy task, or no task). Neural similarity of these item pairs is plotted as a function of list-lag, where list-lag=0 reflects 2 items from the same list, list-lag=1 reflects 2 items from successive lists such as lists 3 and 4. Consistent with properties of temporal context but inconsistent with properties of positional codes, neural similarity decreases as a function of list-lag. Error bars represent Loftus and Masson (1994) 95% confidence intervals.

