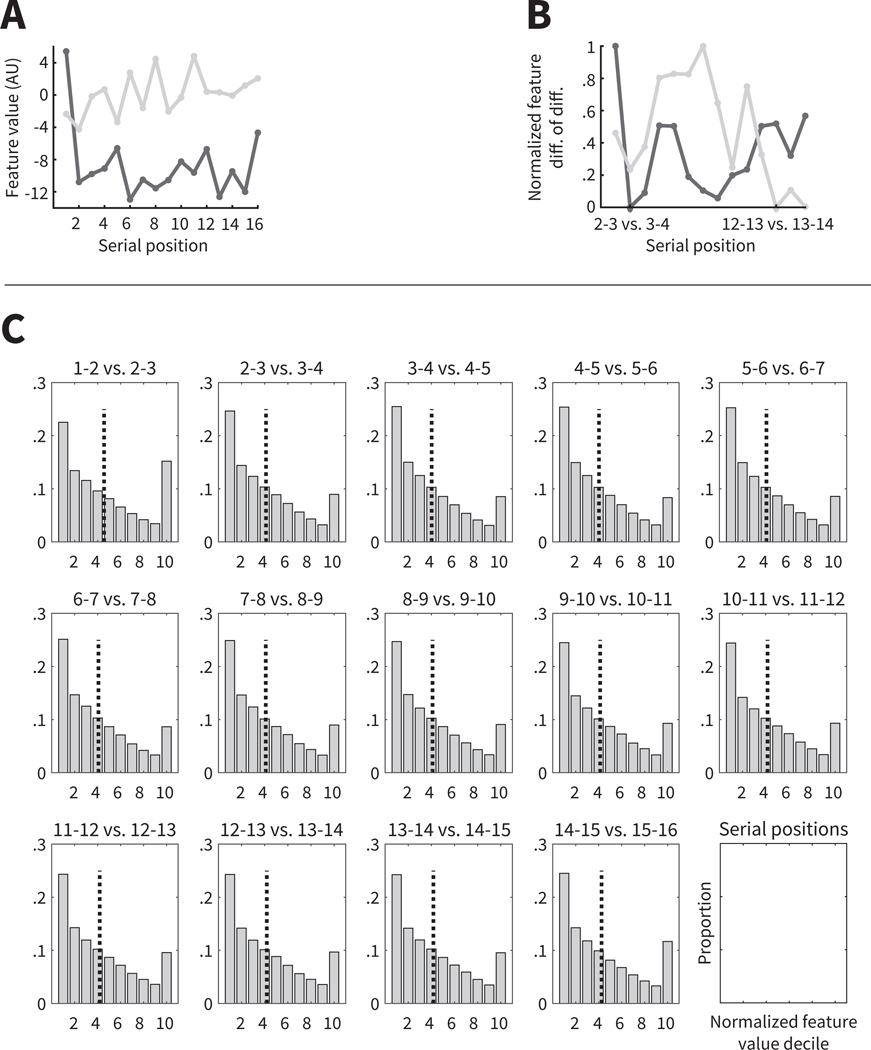
Figure B2. Histogram of feature value differences contributing to each feature vector.
A. Examples of feature vector values for two control lists. B. The absolute value of the difference of differences, rescaled from 0 to 1. These feature value lists were chosen to be representative of more or less autocorrelation in primacy positions (light line and dark line, respectively). C. Histogram of normalized (i.e. absolute value and rescaled) difference of differences for feature vectors across lists, at each set of serial position values. These values were averaged across feature values across lists and participants. Dashed black lines indicate the mean across feature values when averaged by list and participant.

